
Table of Contents

Like an elusive word “on the tip of one’s tongue,” technological disruption in trade finance has been eagerly anticipated but not yet realized. The business remains document driven, balance-sheet heavy and highly price sensitive. Compounded with margin compression and slowing growth rates in global trade volumes, we observe a rationalization—rather than disruption—in the large corporate trade finance landscape.
As the world’s leading banks make “participation choices”—focusing on larger, stickier client needs—the past year has seen a further deconcentration in the market. Market leaders continue to grow more selective, weighing price points against broader relationship returns, and leaving room for the next tiers of banks to gain visibility through an increasingly commoditized product.
Shifts in Strategy
The biggest driver of change in trade finance currently is the shift in strategy on the part of the world’s largest banks. Although the list of 2017 Greenwich Leaders in Large Corporate Trade Finance is still composed of global banks—like BNP Paribas in Europe, Bank of America Merrill Lynch and J.P. Morgan in the United States, and HSBC in Asia—their share of relationships (market penetration) have collectively decreased over the past six years.
In response to these new rules (e.g., NSFR, increased capital requirements) and a seemingly “new normal” of compressed margins and balance sheet pressures, large banks have adjusted their capital commitments to the business. With some degree of variation, most have pulled back from strategies based on capturing broad market share and increased focus on the specific clients, products and geographic regions that present the best profit potential.
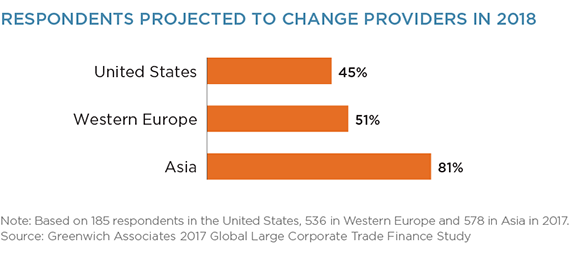
Although the most seismic of these shifts played out over the past several years, retrenchment by big banks is still putting trade finance client relationships and revenues in play—and opening up new opportunities for other providers. Greenwich Associates projects that among large companies using trade finance, approximately 45% of companies in the U.S., about half of European companies and approximately 80% of Asian companies will shift business among trade finance providers in 2018.
That turnover would continue the trend seen this year, with about 60% of companies in the U.S. and Europe and 80% of companies in Asia moving trade finance business among different providers.
This “money in motion” is providing fuel to a range of aggressive competitors, including both established, traditional banks and emerging nonbank firms. In Europe, the diminished activity of global banks is opening the door for local banks that feel pressure to “internationalize” the service offerings in their home market(s) to keep pace with the needs of clients increasingly focused on cross-border trade. Across the European region, second- and third-tier banks are investing heavily in the business and starting to see results. “Although margins are thin and competition is fierce, trade finance still represents the quickest and cheapest way for banks to add an international element to their franchise,” says Greenwich Associates Managing Director Tobias Miarka.
The pullback by big banks and investments by smaller players are creating less concentrated markets, and the average number of trade finance providers used by large corporates is inching higher around the world. As in Europe, U.S. companies are being solicited by up-and-coming smaller and regional banks that see an opportunity to generate revenue with trade finance and establish valuable relationships with large corporates. U.S. companies are also growing provider lists by adding foreign banks capable of delivering specialized coverage in international markets important to their businesses.

Technology Will Drive Efficiencies
Trade finance is perhaps the most paper-based and manual area of the financial services industry. “In terms of sheer lack of automation, trade finance can actually be considered an outlier,” says Greenwich Associates consultant Gaurav Arora. “That makes it a market ripe for disruption.”
The Organisation of Economic Co-operation and Development (OECD) estimates that 15% of the overall value of traded goods around the world is comprised of hidden costs, much of it a result of the manual processes underlying most transactions. This translates into losses of $100 billion per year. Actual costs could be much higher, because these OECD numbers do not take into account the impact of the opacity inherent in these manual systems. With transaction histories stored on paper, it is difficult for banks to access information needed to assess companies’ risk and credit histories, making bank capital more expensive and less available to companies looking to finance transactions.
The lack of automation in trade finance is due primarily to the business involving companies of varying sizes and a wide array of entities—including not only banks, but also carriers, freight forwarders, ports, authorities, and other players. These participants differ widely in terms of available resources/budgets and levels of sophistication with regard to technology. As a result, harmonizing all parties onto a single technology platform has proved difficult.
Even in the U.S. and Europe, where roughly half of trade finance business is executed electronically on bank platforms, relatively few companies say they are using in-house or vendor-provided platforms that could link the various parts of the trade finance value chain. Only 29% of European trade finance customers use a proprietary or third-party platform to manage transactions. In the U.S. and Asia, the share is roughly half that amount.
Change is certainly anticipated in the form of new technologies—including, and perhaps most importantly, blockchain or distributed ledger technology (DLT). But despite a stream of exciting headlines about blockchain advances and ventures around the world, the industry still hasn’t figured out exactly how DLT will function as a common process (versus separate pools of banks) in trade finance, and significant challenges remain ahead for developers.
However, the financial services and tech sectors are committing vast resources to apply DLT to corporate finance. Given the fact that the transactional nature of trade finance makes it perhaps the best and easiest fit for this technology, it seems inevitable that the blockchain will have a material impact on the business eventually.
In all likelihood, that impact will take the form of some type of “smart contracts” that digitize the letter of credit process. Going forward, using DLT to capture transaction-level details on shipment, payment and financial information could allow for much faster and easier matching. A blockchain-enhanced exchange of trade data and auditability of a participant’s credit history would help increase speed, efficiency, and security in financing between buyers, sellers, and their banks. Finally, expanded access to transaction/business history within the digital chain would provide greater transparency to banks with regard to small and medium-sized enterprises (SMEs), enlarging input into bank credit risk models and potentially lowering credit costs/expanding availability.
Greenwich Leaders: Europe
Although turnover rates in the European trade finance business remain high by any historic standard, they have actually come down slightly from those of the past several years. That previous period featured the realignment of RBS and the continued strategic repositioning of other large European and global banks, a process that freed up trade finance relationships and left many companies seeking new providers.
Regional banks like Natixis in France and Intesa Sanpaolo in Italy have taken advantage of this churn to establish themselves more prominently in the business and win trade finance clients in their home markets. Reflecting companies’ need for replacement providers and the availability of new options among both banks and nonbanks, the average number of trade finance providers used by companies across Europe is on the rise.
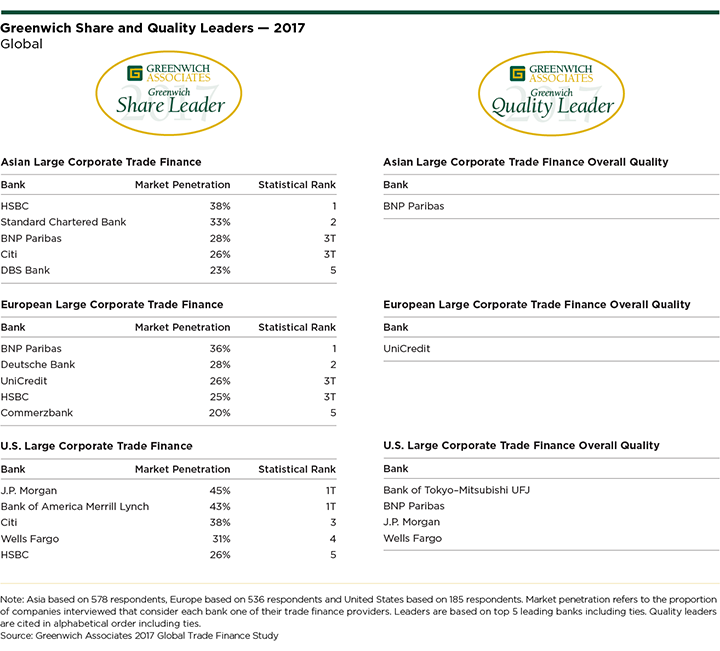
In this still-shifting environment, BNP Paribas maintains the position of clear-cut leader. Thirty-six percent of large European companies use BNP Paribas for trade finance, far outpacing the 28% of companies using second-ranked Deutsche Bank. Statistically tied at 25%, UniCredit and HSBC are close behind, followed by Commerzbank at 20%. These banks are the 2017 Greenwich Share Leaders℠ in European Large Corporate Trade Finance. The 2017 Greenwich Quality Leader℠ in this category is UniCredit.
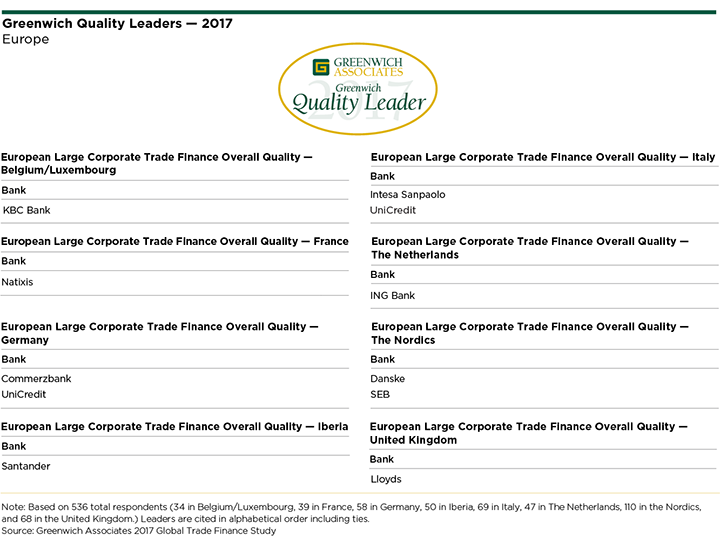
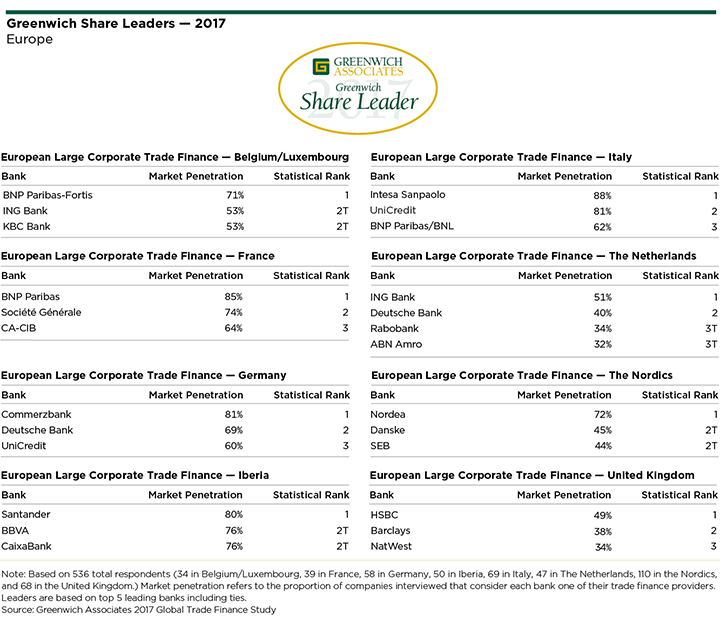
BNP Paribas tops second-place Société Générale in market penetration in their home market of France, while in Germany, Commerzbank maintains a commanding lead over No. 2 Deutsche Bank and third-place UniCredit. The accompanying table presents the complete list of Greenwich Share and Quality Leaders in each of the major country markets of Europe.
Greenwich Leaders: United States
Two trends are driving change in the U.S. trade finance market: 1) U.S. companies are expanding their overseas trade and taking on new trade finance relationships to support this growing international business, and 2) Companies are experimenting with nonbank providers in various parts of the trade finance value chain.
U.S. companies are rapidly expanding their use of trade finance providers for transactions into and out of regions outside their domestic borders. Forty-eight percent of large U.S. companies now use trade finance, and of these, 58% now use a trade finance provider for European transactions, up from just 49% in 2015. For Asian trade finance, that share has jumped to 62% from 52% over the same period. Robust gains were also recorded in trade financeassociated with business in Central and Eastern Europe, the Middle East and Africa, and Latin America. (Over the past 12 months companies’ use of providers for trade finance in Latin America has leveled off, while other regions continue to grow.)
This increased use of international trade finance has expanded the number of providers used by U.S. companies, while boosting business for regional powerhouses like Deutsche Bank in Western Europe, J.P. Morgan in Asia and Citi in Latin America. It is also providing opportunities for local banks seen as specialist providers in their home regions.
Also contributing to the increase in the number of providers used by U.S. companies for trade finance is the growing number of nonbank players competing for the business. About 10% of U.S. companies have engaged a nonbank provider for some aspect of trade finance. The most commonly cited nonbank provider is PrimeRevenue, a cloud-based supply chain finance platform for managing and optimizing cash flows. Companies also cite Bolero International, an early leader in electronic trade finance documentation and automatic settlement.
Despite these changes to the industry, the names of the banks that dominate the U.S. trade business remain largely the same. Well over 40% of large U.S. companies use J.P. Morgan and/or Bank of America Merrill Lynch for trade finance, making these two firms the clear leaders in the category. Citi is third at 38%, followed by Wells Fargo at 31% and HSBC at 26%. These banks are the 2017 Greenwich Share Leaders in U.S. Large Corporate Trade Finance. Four banks share the title of 2017 Greenwich Quality Leader: Bank of Tokyo-Mitsubishi-UFJ, BNP Paribas, J.P. Morgan, and Wells Fargo.

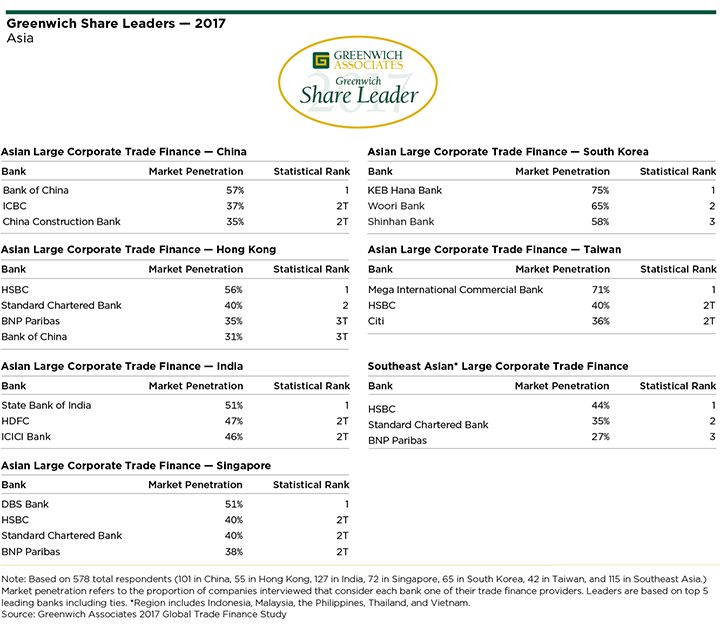
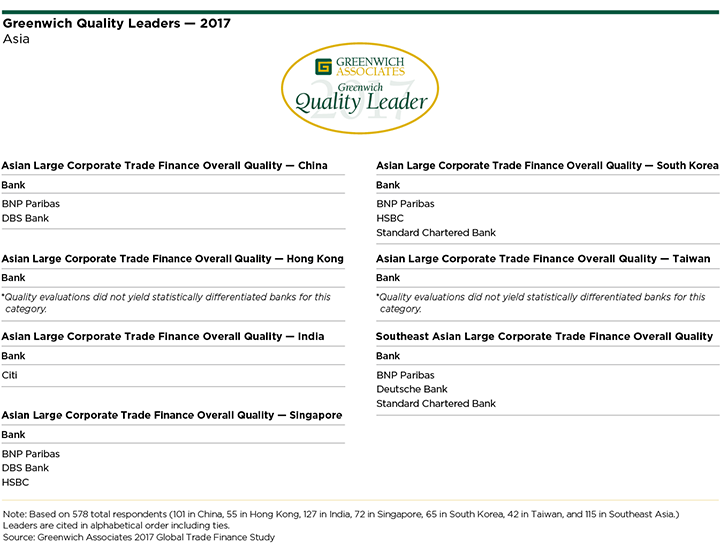
Greenwich Leaders: Asia
In Asia, the strategic shift on the part of global banks has been twofold. At the most basic level, many banks re-evaluated their resource commitment to the Asian trade finance business as part of their broad strategic response to crisis-era reserve requirements and balance sheet pressures. While some banks pulled back from the region altogether, most banks changed strategy by growing more selective in which client relationships they saw the most sustainable earnings potential.
That shift in focus gives rise to the second major element of their strategic shift: Global banks are concentrating their resources on the higher-value aspects of the trade finance cycle. In particular, they are focusing on cash flow management and supply-chain financing, businesses with profit margins much higher than those associated with letters of credit and other more traditional trade finance products.
“As a result, Japanese banks and other local Asian banks have found a wide-open playing field for trade finance ‘flow’ products,” says Greenwich Associates consultant Gaurav Arora. “Meanwhile, the global banks that have always been a presence in this market have not gone away. They have just become more selective in the plainvanilla aspects of the business, as they shift their attention to working capital advisory solutions and complex supply chain needs.”
The list of 2017 Greenwich Share and Quality Leaders reflects this fast evolution of the marketplace. In terms of market penetration across Asia, the top four spots are held by global banks: HSBC at 38%, Standard Chartered at 33% and BNP Paribas and Citi, which are statistically tied for third with 28% and 26% respectively. But at 23%, DBS Bank ranks fifth and is closing in on the global leaders. DBS Bank is the top trade finance provider in its home market of Singapore, as are Bank of China in China, State Bank of India in India, and KEB Hana Bank in South Korea.
In terms of quality, local providers have not yet caught the global leaders. The 2017 Greenwich Quality Leader in Asian Large Corporate Trade Finance is BNP Paribas. The accompanying table presents the complete list of Greenwich Share and Quality Leaders in each of the major country markets of Asia.
Consultants John Colon and Don Raftery specialize in corporate banking, cash management and trade finance services in North America. Consultants Dr. Tobias Miarka, Markus Ohlig and Melanie Casalis specialize in corporate and investment banking, as well as transaction banking in Europe. Consultants Paul Tan and Gaurav Arora specialize in corporate and transaction banking in Asia.
MethodologyTrade finance interview topics included product demand, quality of coverage and capabilities in specific product areas.
Europe
Based on 536 interviews with corporates with annual revenues of EUR500 million or more, across Belgium, France, Germany, Italy, Luxembourg, the Netherlands, Nordic countries, Portugal, Spain, and the United Kingdom.
United States
Based on 185 interviews with corporates with annual revenues of $2 billion or more.
Asia
Based on 578 interviews with corporates with annual revenues of $500 million or more, across China, Hong Kong, India, Indonesia, Malaysia, the Philippines, Singapore, South Korea, Taiwan, Thailand, and Vietnam.