Table of Contents

Key Takeaways for August 2019
- The rate cut on July 31st elevated volumes in what is traditionally a slow summer month, with the first two weeks providing a big bounce for trading platforms as market participants waited for the Federal Reserve’s rate cut announcement.
- Central limit order book markets saw their best month in at least a year, with market volatility catalyzing electronic market-marker activity at those venues.
- The busy month also generated e-trading records, both for the market as a whole and for dealer-to-client trading, with the screen increasingly providing faster price discovery than the phone.
- U.S. Treasury futures volume was 97% of bond market volume, in the first week of August, a level usually only hit during roll periods.
- SOFR futures open interest hit another record at the end of August but remains just shy of 2.2% of Eurodollar future open interest.
A Good Month for CLOBs
Volatility in the U.S. Treasury market continues to be volatile and largely driven by comments from Washington. August’s volatility, as measured by the TYVIX, was up 27% from the previous month and came on the back of the Fed’s July 31st interest-rate cut. The trading volume that accompanied the volatility made a traditionally quiet August a good month for trading venues and electronic market makers alike, with a record 71% of volume traded electronically, up from 61% a year ago.
The average daily volume for all of August was $610 billion. The first week of the month saw an average daily volume of $737 billion, however, driving up the average for a month that would have otherwise stood more in line with past Augusts. Nevertheless, a considerable amount of that volume was directed at the order book markets— CME Brokertec, Dealerweb, FENICS UST, and Nasdaq—which all saw volumes rise between 30–40% from the previous month. Collectively, order book trading accounted for 45% of electronic trading in August, the most since we began tracking this metric a year ago.

It is also worth noting that LiquidityEdge also saw its volumes rise 35% from the previous month, helped not only by the market but also by its acquisition by MarketAxess—a move viewed favorably by most of the market. Direct streaming continues to account for 7–8% of electronic trading volume.
SOFR
SOFR futures open interest continued its steady climb upward, ending the month at another record high. It is important to keep that growth in perspective, however, as SOFR futures open interest is just 2.2% of Eurodollar OI and 2.7% of U.S. Treasury futures OI. Nevertheless, the Libor transition is an absolutely gigantic task that puts past market structure changes, such as the move to clear swaps and uncleared margin requirements, to shame. It is an absolutely necessary change, as there is no reason why the market shouldn’t utilize the mountains of observable data to determine key benchmark rates. But the legal, operational and technical challenges that still lie ahead are some of the most complex the industry has faced in what has already been a decade of serious change.
Note: The data underlying this analysis is available to subscribers of Greenwich MarketView. MarketView provides continuous access to these metrics, updated daily, weekly or monthly based on the frequency of the source data.
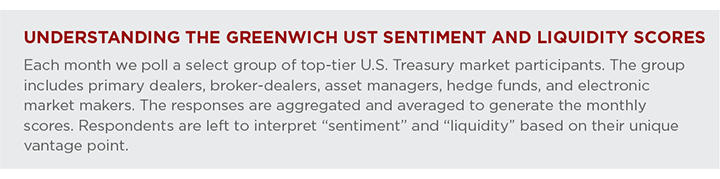
Greenwich Associates continuously gathers data and insights from U.S. Treasury market participants including asset managers, hedge funds, primary dealers, market makers, and trading platforms. The data, once aggregated, normalized and enhanced, is analyzed by our market structure research team who identify key areas of change and the likely direction of volume, holdings, market share and other trends in the coming months.