
High-Yield ETFs Increase Their Role in Bond Markets
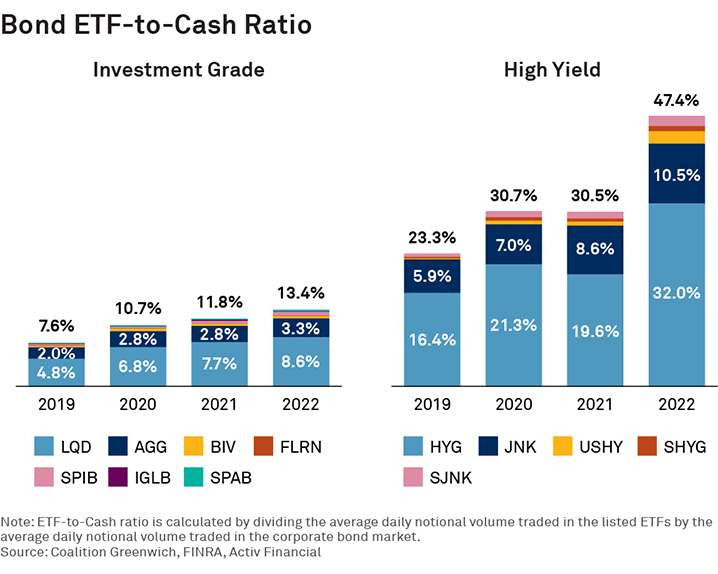
A recently published Coalition Greenwich research study found that trading in credit-focused ETFs has grown notably relative to the underlying corporate bond market (what we’re calling the ETF-to-cash ratio). In notional terms, the volume traded in credit ETFs in 2021 equated to 18% of corporate bond market volume—investment grade and high yield combined. In 2022, that percentage jumped to 23%.
With this research in hand, we dug a little deeper to understand the differences between investment-grade and high-yield ETF market dynamics:
High-Yield Interest Leads the Way
The ETF-to-cash ratio for high-yield bonds averaged nearly 50% in 2022, up from 30% the year before. HYG and JNK were the most heavily traded ETFs by a wide margin. Trading activity in those two alone made up 42% of notional volume transacted in the underlying high-yield bond market.
Investment-Grade Trading is Smaller, but Growing
Trading in investment-grade ETFs, primarily LQD and AGG, rose from 7.6% in 2019 to 13.4% in 2022. This is considerably less than the high-yield ratio but still represents solid growth—especially considering average notional volume of investment-grade bond markets is roughly three times larger than high yield.
Our research also revealed that the LQD-to-cash ratio (comparing volume in only LQD to the underlying investment-grade bond market) in 2022 (8.6%) was higher than the overall investment-grade ETF-to-cash ratio (including all investment-grade ETFs) in 2019 (7.6%). The outsized role this single ETF plays is another sign of how dominant the largest credit ETFs have become.
Why Should You Care?
Corporate bond market participants struggled for years after the financial crisis to find reliable methods of hedging credit risk and discovering more liquid entry points for taking directional bets. Single-name credit-default swaps (CDS) used to play that role before Dodd-Frank restrictions dried up the market. Credit futures have also been introduced but have not yet succeeded in gaining much traction.
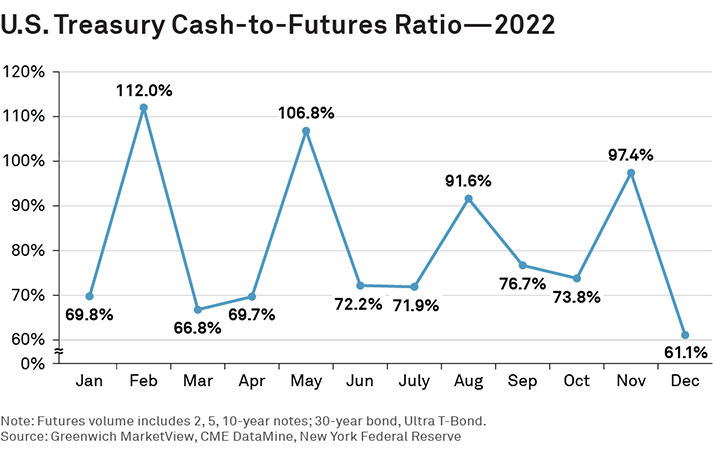
Rates trading, by comparison, has been comparatively easier. Trading volume in the U.S. Treasury futures markets averages 70% of volume in the underlying bond market (spiking near or over 100% on futures roll months), providing an easy source of hedging or exposure. Post-Dodd-Frank, the cleared interest-rate swaps market is also highly liquid and electronic. Side note: While Treasury-focused ETFs have grown in popularly in the past year, they only equate to 1% of cash market volumes.
Fixed-Income ETFs are Versatile and Easy to Use
Credit ETFs allow money managers to put cash to work while seeking out the underlying bonds they intend to hold for the long term. Market makers use ETFs to manage risk and liquidity in the secondary market or through the create-redeem process. Meanwhile, retail investors rely on ETFs to gain quick bond market exposure in a world where the technology to trade stocks and ETFs is readily available and easy to use, and cash retail bond market trading technology is neither of those things.
Overall, the uptick in fixed-income ETF adoption has been a good thing for the market. Better market access leads to more people in the market, which is ultimately good for both primary and secondary liquidity. We believe the pandemic market crisis of 2020 proved that credit ETFs are reliable and work under pressure.
While many benefits are apparent, there is still some risk (albeit small). For instance, trading in ETFs may actually remove liquidity from the cash bond market. This raises the question of whether ETF volume would be bond market volume if ETFs didn’t exist. We think it probably wouldn’t. But one can understand why some bond traders might feel threatened.
Exactly how these interactions will evolve and which funds will grow (or not) is hard to predict. However, one thing is certain—the codependence between bonds and ETFs is here to stay.
Kevin McPartland advises on market structure and technology globally. Neha Jain provides market-structure-related data analysis.