Tale of the Tapes: Monday Market Meltdown Winners and Losers
August 25, 2015
By:
Craig Viani
First of all, let’s give a nice round of applause to all market participants on Monday. And by nice I mean more like the warmhearted ovation from a "filmed before a live studio audience" sitcom as opposed to a genial, drops-a-2-footer-for-par golf clap from a sparse gallery.
In May 2010, when the Dow dropped 900 points, traders were quick to recognize it as a synthetic event. Markets just weren’t built to move that far that fast. On Monday, although fundamentals were clearly the driver, markets had similar percentage swings in both directions in slightly longer time frames. It’s amazing how only five years on from that seminal event, the speed, capacity and robustness of market centers have grown and matured to expertly handle such volume and volatility.
Let’s hope this is another positive sign of our market structure resiliency.
Of course, not all participants benefited equally from the burst in liquidity. Some venues appeared to capture more of the surge than others. Breaking the volumes down tape-by-tape, an interesting picture emerges relative to where orders are routed when market become unstable.

Tape A
The largest of all markets, Tape A represent volumes executed in NYSE-listed securities. With 6.6 billion shares traded as compared to the average 3.8 billion daily for the month, Tape A volumes were up 74%. Total market volumes on Monday were up 92% (14.2 billion vs 7.4 billion), so NYSE-listed names lagged just a bit.
The clear winners for Tape A flow were NASDAQ and BATS BZX gaining 1.5% and 1.2% market share, respectfully. The NYSE also gained 1.2% in their own names, a nice bump but not as big of percentage move as the other two venues. The redistribution of this flow mainly came from volumes shifting off the TRFs which dropped a combined 3.8% in market share. Both NASDAQ and NYSE TRFs report trades that occur in venues that are not exchanges. This includes dark pool trades and orders internalized by broker dealers on their “upstairs” trading desks. On average, internalized flow accounts for around 66% of the TRF and dark pools roughly the other one-third.
Tape B
 Traditionally the market for AMEX and regional exchange-listed securities, today Tape B largely represents ETF volumes most of which are listed on ARCA. Tape B was the big winner with volumes on 8/24 jumping to 4.1 billion shares as compared to the MTD average of 1.6 billion, or a 156% increase.
Again, the TRFs dropped during this burst in volatility, losing 6.3% of the market share. BATS BYX didn’t fare so well either, drifting 0.6% lower for the day. Counterbalancing this decline, ARCA, NASDAQ and BATS BZX made the largest gains. ARCA benefited from a jump in their listed names by picking up 3.1% of the volume while the NADSAQ and BATS BZX grabbed 2.5% and 1.9%, respectively.

Tape C
Finally, Tape C represents the volumes in all NASDAQ-listed securities. Tape C had a similar pop in volumes to Tape A, with a 74% increase as 3.5 billion shares executed on 8/24 as compares to 2.0 for the month.
Again, the pattern is clear. TRF volumes in aggregate dropped 4.5% while the NASDAQ and BATS BZX gained a like amount combined (4.8%). As with Tape A and B, the exchange that listed the names on each Tape had significant pops in volume with BZX consistently riding the coattails.
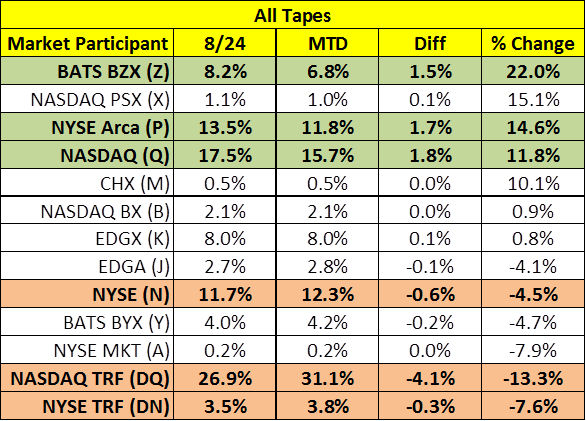
All Tapes

Summing Up and Drilling Down
On the surface, the headlines will read that dark pools and upstairs trading were dragged to the corner for a time out while panicky retail investors and aggressive professional traders attempted to move their flow through displayed venues. Although, this is generally true, when we drill down into the venues where the flow increased, the picture shifts from a pixelated selfie to a more refined portrait of order routing hierarchy in tumultuous times.
Flight to Certainty
With stories of record days for high frequency firms like Virtu, many would assume that order flow on Monday would have dramatically increased in inverted pricing exchanges where liquidity providers pay exchanges to post their orders. The story goes like this: HFT pays to posts flow to inverted exchanges. Brokers remove from inverted exchanges so they can receive a rebate. Since HFT orders increased as the markets bungeed off a cliff and bounced around, logic dictates that volumes in inverted exchanges like EDGA, BYX and BX would pop. But looking at the numbers, inverted pricing exchanges actually lost a modest 3% market share during Monday’s trading.
In fact, it was the primary listing exchanges and BATS (traditionally priced exchange) BZX that picked up the most flow. Essentially, what we witnessed was a flight to certainty. In highly volatile environments, the need to get completed with immediacy (and presumably at a better price now then later) overrides the incentives of inverted pricing markets for both the provider and remover.
Essentially, when spreads are a penny and liquidity piles up on both sides of the market, gamesmanship in queue positioning drives flow to inverted venues. When liquidity becomes less stable, the certainty of completion takes center stage.
In this respect, HFT firms and (the more sophisticated) broker dealers have built mature, dynamic routing configurations which regulate order flow based on market conditions. HFT have finely calibrated their flow based on the bid-ask spread. As spreads widen beyond a penny, the economic advantages of inverted pricing diminish and risk increases. For brokers, volatile markets limit their effective use of benchmark algos (e.g. VWAP) or dark pool/liquidity seeking strategies that sprinkle multiple orders across venues on the primary side of the NBBO or within the spread. In lieu of passive order placement, traders "go manual" and drive most of their orders through aggressive smart order routers.
For brokers, not only do inverted venues lose their appeal, but so do many non-displayed pools. By their nature, dark pools forgo certainty for anonymity. So, in these market conditions, it's no surprise dark pools volumes will contract. But, behind the order routing curtain, we are likely to find out that not all dark pools will suffer the same fate equally.
Dark Pools Drivers Not So Black and White
I have written before about the generic nature of most dark pool liquidity. In short, many broker dark pools are populated with flow from other broker dealers' algos and HFT firms. Although this may not vary greatly from the liquidity available in displayed markets, the important differentiator is that your likelihood of getting filled against a quote in the displayed market (with a good SOR) is 95% or higher, where most dark pool hit rates clock in at less than 5%.
Given the unpredictability of Monday’s market, most participants were likely to reduce their overall exposure to dark pools. But when the dust settles, we may see a separation in the usage pattern for this week toward a few of the larger and/or unique venues and away from the long tail of the generic ones.
No doubt, the smaller pools are the first to be culled. Of the 37 dark pools active in June, 7 traded over 50 million shares while 14 traded under 5 million a day. Routing to a venue that has a 1% hit rate and 0.1% of market share, makes little sense in normal markets and less in volatile times. Of the larger pools, the venues that can secure positioning in brokers routing tables as legitimate sources of liquidity will hold market share versus the ones that lack definable characteristics and show explicit value. IEX has already achieved that status. A peek at Monday’s volumes shows their market share of 1.4%, in line with their position earlier in the month and before the market quake. It will be interesting to see what other dark pools holds their ground when the FINRA data for this week is eventually published (i.e. likely fodder for another blog post).
One final note: in these whippy markets, block venues will likely suffer in the short term. The silver lining, though, should be an eventual boost in institutional volumes after the dust settles and money managers unload unwanted or put on opportunistic, larger positions. There will always be a place for block trading platforms to pair natural liquidity, but for the next few days, while PMs rush back from their summer homes, blocks will be taking a vacation.
All data from BATS Market Volume Summary http://www.batstrading.com/market_data/daily_volume/