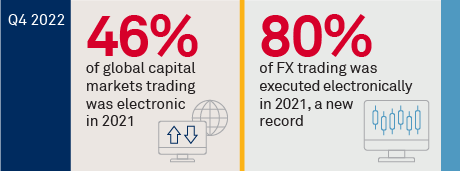
Thus far, 2022 has been net positive for e-trading around the world. Growth in some cases is even greater than the percentages suggest, given the percentage of volume traded electronically has grown even while the total market volume (the denominator) has also grown.
The key dynamic to note is the impact of volatility on trader preference for electronic vs. manual methods. A decade ago, volatility meant the screens went quiet as everyone called their broker-dealers for market color. Today, periods of volatility often drive the opposite, bringing more volume to the screen. Sell-side trading desks are notably smaller, making it harder to handle what would be the infux of customer calls. The buy side knows this, so it increasingly dives into electronic markets when things get rocky.
MethodologyThroughout 2021, Coalition Greenwich interviewed 720 asset managers, hedge funds, insurance companies, and government entities globally to better understand their trading activity and dealer relationships. Electronic trading percentages are based on the aggregate of reported levels of e-trading for each firm in each individual asset class. Electronic trading is defined differently in each asset class but broadly includes trades that were executed via a multidealer electronic channel, such as an exchange central limit order book or request-for-quote platform. Electronic trading does not include trades executed via chat or email.

