
Table of Contents
The electronic trading landscape is changing quickly. MarketView’s timely, data-driven insights will help you stay ahead of the market structure evolution.
The growth of electronic trading and regulators’ push for more transparent markets have increased the availability of high-quality market data. However, gathering, normalizing and making sense of that data remains a challenge.
MarketView combines unique research from Coalition Greenwich, publicly available market data and the insights of our analyst team to quantify the growth of electronic trading in fixed-income and FX markets. The results include trading-platform market share and electronic trading trend data with a level of accuracy not available anywhere else.
Our list of customers includes sell-side traders, buy-side traders, trading-venue strategists, product managers and buy-side equity analysts covering the progress of global exchanges and trading venues.
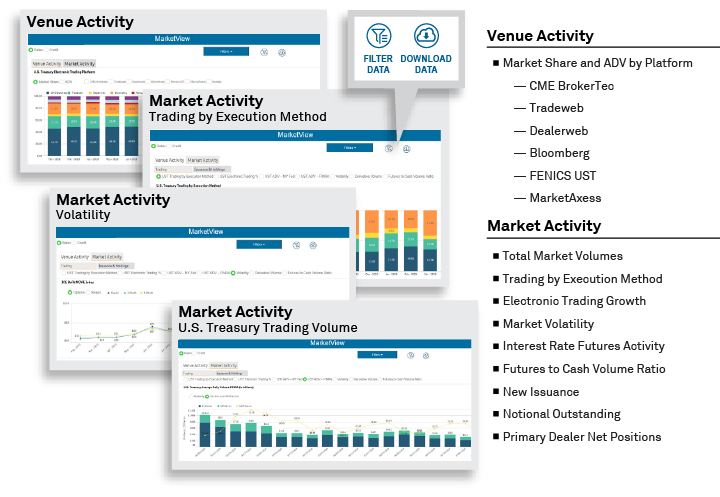
Greenwich MarketView Rates Data
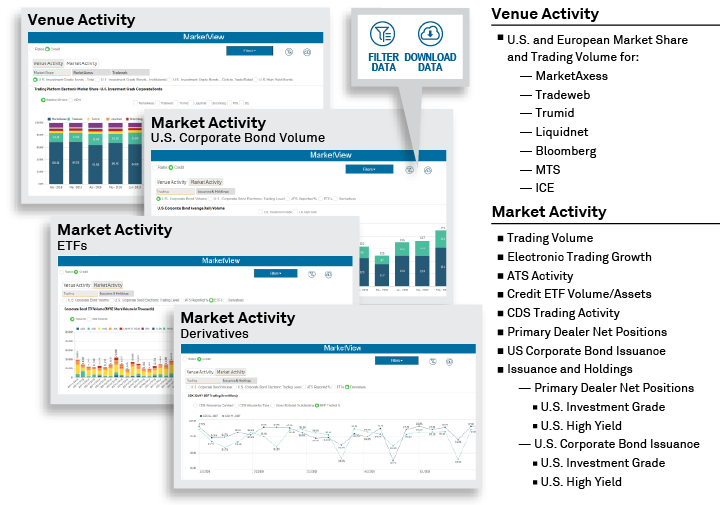
Greenwich MarketView Credit Data
June Data Spotlight: There are more U.S. Treasury trading venues than you think
June 2026
Electronic U.S. Treasury volume in May grew 17% from May 2025, with nearly $670 billion in bonds trading via trading venues and direct electronic links between counterparties.

June Data Spotlight: Why dealers are net short corporate bonds
June 2026
Investment-grade bonds continued their journey toward flow status in May, with the average daily notional volume (ADNV) up 18% and electronic trading volume up 17% year over year.

Municipal bond e-trading reaches new record
May 2026
Nearly 21% of municipal bond volume traded via multidealer trading venues in Q1 2026, eclipsing both the previous quarter and the high-water mark set in Q4 2023.