
Table of Contents

Key Takeaways for Q3 2019:
- Electronic trading levels for investment-grade and high-yield bonds are at record highs but still have room to grow.
- The secondary market for U.S. corporate bonds is much more active in 2019 than it was the previous year, with average daily volumes up 15% year to date at the end of July.
- Credit-related ETF activity has remained elevated since Q4 2018, as measured by trading volumes and net assets.
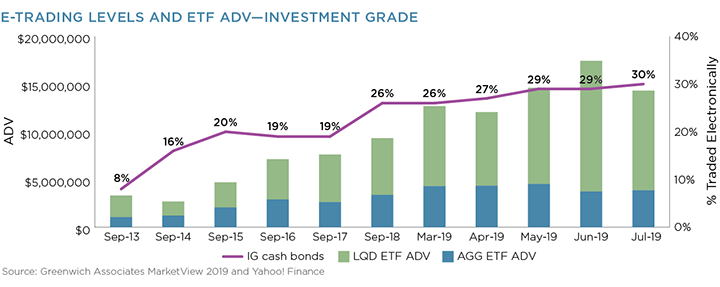
E-Trading is Growing Again
Electronic trading growth for corporate bonds began in earnest in 2013, when Greenwich Associates data showed that 8% of investment-grade and 2% of high-yield bonds (by notional value) traded electronically. In 2015 the percentage jumped to 19%, but then remained stagnant through the early part of 2018. During this time period, the absolute volume traded electronically grew, even though the relative value of electronic trading remained the same. In hindsight, the market spent these years adapting to new protocols (e.g., all-to-all), new platforms (e.g., Trumid) and new liquidity providers (e.g., Jane Street), working to understand how price discovery would work within this new market structure before pressing ahead to automate even more of the corporate bond trading workflow.
Fast forward to 2019, and the market now understands. E-trading rates for investment-grade bonds have increased consistently since Q4 2018, reaching nearly 30% of market volume in July, with high yield hitting 12%—both new records. And this is all happening while the total average daily volume in the U.S. corporate bond market is growing— up 15% year-to-date in 2019 as compared to 2018—which means the absolute electronically traded volumes are up even more. There are many catalysts for e-trading growth, several of which are also supporting the huge valuations of the main fixed-income-only platforms (think MarketAxess, Tradeweb).
As recently as five years ago, when markets got volatile, the buy side’s inclination when executing a trade was to move away from the screen and pick up the phone. That approach has shown signs of reversing, with investors finding the price-discovery process in times of stress more effective on trading venues, as they have mechanisms to both reduce information leakage and to unearth liquidity from a much longer list of market makers than manageable via the phone or instant message. In fact, our data, based on interviews with over 100 U.S. corporate bond investors in 2019, shows that the ability to send a RFQ to as many dealers as possible is a top reason for trading electronically in the first place. As such, the trade war and Federal Reserve-inspired gyrations in the markets over the past months have been a plus for e-trading.
The Impact of Fixed-Income ETFs
The growth in trading of credit ETFs is also a major factor, impacting corporate-bond market structure in several ways. In fact, the last five years in corporate bond e-trading growth tracks quite closely to the trading volume growth of the largest corporate bond ETFs. While we can’t prove causation here, the correlation is certainly notable.

First, the ETF arbitrage trade—trading ETFs alongside a basket of its components—created a natural entry point for electronic market-making firms to begin trading corporate bonds. Before this, trading in the corporate bond market was seen as too slow and too low frequency. Almost by definition, these new market makers trade most if not all of their bond volume electronically, boosting overall e-trading levels. Originally, this was done via anonymous all-to-all markets such as ICE, MarketAxess Open Trading and Tradeweb Direct. More recently, it includes name-disclosed trading via RFQ and portfolio trading, both injecting much more volume (and liquidity) into electronic markets.
This trend then encouraged the largest corporate bond dealers to up their e-trading game, improving their ability to auto-respond to an increasingly large number of RFQs, including more bonds and larger-sized trades. And given the fact that most clients trading corporate bonds electronically tend to utilize list trades (aka RFQ-to-all) looking for the liquidity they need, the ability to be the best and the fastest is increasingly critical.
And lastly, the broader trend toward index investing has resulted in a longer list of index-tracking mutual funds and ETFs, all which must constantly adjust their portfolio mix to deal with outflows and to ensure they’re efficiently tracking the index. These trades, often odd lots, are the bread and butter of corporate bond e-trading.
How Much of the U.S. Corporate Bond Market Can Trade Electronically?
All of the above work in a virtuous cycle and paint a new picture of the old adage “Liquidity begets liquidity.” It is true that electronic trading does not always equate to liquidity. There is still a long list of very illiquid names and block trades that make up the bulk of the 70% of volume traded over the phone or IM. However, the mechanisms now in place for trading corporate bonds electronically allow for price discovery even when no observable data exists—something we will explore in more detail in upcoming research.
We’re asked often how much of the U.S. corporate bond market could ultimately be traded electronically. There is no technological limitation at this point—technology does much more complex things than match buyers and sellers of multi-billion dollar bond positions. It is the human element (people still like to talk to people), the ability and/or willingness of bondholders to sell the bonds they already have, and generally held beliefs on what is considered electronic trading that make up the glass ceiling over bond e-trading.
As of July 2019, 40% of dealer-to-client trading of U.S. Treasuries was done electronically (66% if you include the entire market). Given the highly liquid nature of the U.S. Treasury market and a very limited electronic wholesale market for corporate bonds (as compared to U.S. Treasuries), a glass ceiling of roughly 40% feels reasonable. We would argue to go beyond that would require both a leap of faith by traders that they can safely communicate information and transact digitally even when trade sizes get into the tens of millions. We would also have to expand our minds to include new methods of matching buyers and sellers of illiquid securities that go beyond RFQ, CLOB and even direct pricing streams.
Whether these changes come or not, continued relative growth will be slow but steady. And this isn’t necessarily bad for the trading venues, as total market volumes seem to be increasing and the value of their data is rising even faster. While an equity market crash could hurt stock prices in the coming months, the opportunity for growth in digitizing the bond market will continue on without a scrape.
Note: The data underlying this analysis is available to subscribers of Greenwich MarketView. MarketView provides continuous access to these metrics, updated daily, weekly or monthly based on the frequency of the source data.

Greenwich Associates continuously gathers data and insights from credit market participants, including market makers, primary dealers and trading platforms. The data, once aggregated, normalized and enhanced, is analyzed by our market structure research team who identify the key trends of trading in the credit markets, with a focus on corporate bond electronic trading and trading platform market share.