

Table of Contents
RBC Capital Markets leads the Canadian equity brokerage space by an extent rarely seen in other markets around the world.
As part of its 2015 Canadian Equity Investors Study, Greenwich Associates interviewed 60 institutional portfolio managers and 59 institutional traders about the brokers they use for Canadian equities. Study participants were asked to name the providers they use for research/advisory services, trade execution and other services, to estimate the share of their overall commission volume allocated to each firm, and to rate the quality of service they receive from each provider.
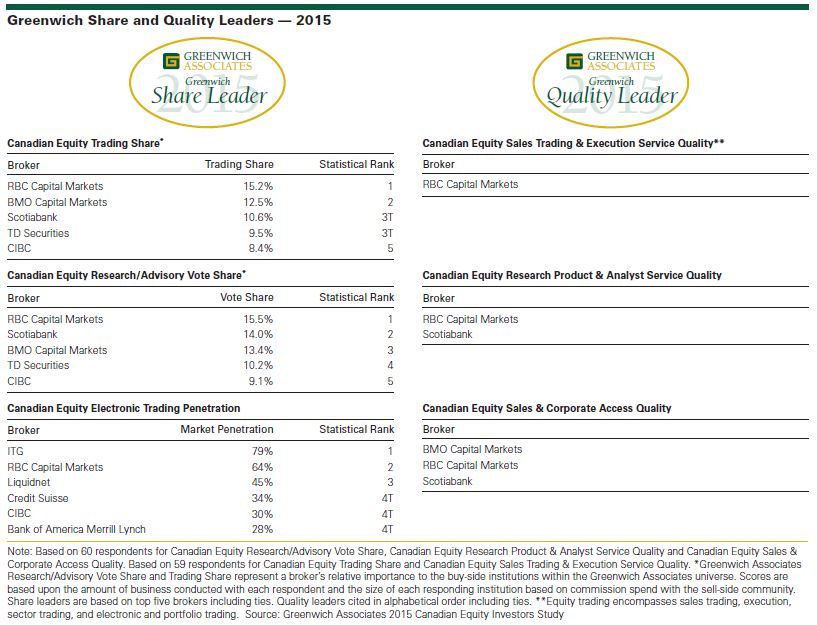
The study results show RBC Capital Markets captured 15.2% of institutional trading commissions in Canadian equities last year, far surpassing its nearest competitor, BMO Capital Markets, which achieved a share of 12.5%. Scotiabank and TD Securities tied for the third spot with commission shares of 9.5–10.6%, followed by CIBC at 8.4%. These firms are the 2015 Greenwich Share Leaders in Canadian Equity Trading. RBC Capital Markets is also the 2015 Greenwich Quality Leader in Canadian Equity Sales Trading & Execution Service due to its comple-
mentary strengths in both high-touch and low-touch execution.
The commanding leadership positions of the “Big Five” Canadian full-service brokers rest heavily on their franchises in equity research/advisory services. While some brokers capture incremental trading business above and beyond that generated by their research functions due to their willingness to commit capital, new issue deal flow and other factors, buy-side trading desks allocate about 60% of their U.S. equity trade commission payments to compensate providers of research/advisory services, including analyst service, sales, corporate access, and other services.
RBC Capital Markets leads all rivals with a 15.5% share of the institutional commission-weighted research vote, followed by Scotiabank at 14.0%, BMO Capital Markets at 13.4%, TD Securities at 10.2%, and CIBC at 9.1%. These firms are the 2015 Greenwich Leaders in Canadian Equity Research/Advisory Vote Share. The 2015 Greenwich Quality Leaders in Canadian Equity Sales & Corporate Access are BMO Capital Markets, RBC Capital Markets and Scotiabank. RBC Capital Markets and Scotiabank take the title of 2015 Greenwich Quality Leaders in Canadian Equity Research Product & Analyst Service.
“All of the leading brokers complement full-service trade execution, investment banking and capital markets capabilities with a robust, high-quality research component,” says Greenwich Associates consultant Jay Bennett. “Brokers and research providers in the market’s second tier are a mix of regional Canadian banks, foreign brokers and specialist research providers often focused on the energy, metals and mining, and financial companies that make up such a big part of the Canadian market.”
Electronic Trading
Electronic trading is another factor influencing the competitive positioning of Canadian brokers. Electronic trading accounts for about 8–10% of the overall annual institutional pool of commissions collected by brokers on trades of Canadian equities. Although that amount falls far short of the 15% of total institutional commissions now generated by electronic trades in the United States, brokers realize that e-trading is becoming an ever more important driver of trade volumes and commissions.
ITG is widely seen as having been the “first mover” in electronic trading, and 79% of institutions now use the firm for electronic execution. RBC Capital Markets is next with a market penetration score of 64%, followed by Liquidnet at 45%, then Credit Suisse, CIBC and Bank of America Merrill Lynch, which are tied with market penetration scores of 28–34%.
Consultants Jay Bennett and Peter Kane advise on institutional equity markets globally.
MethodologyBetween December 2014 and February 2015, Greenwich Associates interviewed 60 Canadian generalist equity portfolio managers and 59 Canadian equity traders at buy-side institutions. The study participants were asked to evaluate the sales, research and trading services they receive from their equity brokers and to report on important market practices and trends.
The findings reported in this document reflect solely the views reported to Greenwich Associates by the research participants. They do not represent opinions or endorsements by Greenwich Associates or its staff. Interviewees may be asked about their use of and demand for financial products and services and about investment practices in relevant financial markets. Greenwich Associates compiles the data received, conducts statistical analysis and reviews for presentation purposes in order to produce the final results.
© 2015 Greenwich Associates, LLC. All rights reserved. No portion of these materials may be copied, reproduced, distributed or transmitted, electronically or otherwise, to external parties or publicly without the permission of Greenwich Associates, LLC. Greenwich Associates®, Competitive Challenges®, Greenwich Quality Index®, and Greenwich Reports® are registered marks of Greenwich Associates, LLC. Greenwich Associates may also have rights in certain other marks used in these materials.
The Greenwich Quality LeaderSM and Greenwich Share LeaderSM designations are determined entirely by the results of the interviews described above and do not represent opinions or endorsements by Greenwich Associates or its staff. Such designations are a product of numerical scores in Greenwich Associates’ proprietary studies that are generated from the study interviews and are based on a statistical significance confidence level of at least 80%. No advertising, promotional or other commercial use can be made of any name, mark or logo of Greenwich Associates without the express prior written consent of Greenwich Associates.