

Table of Contents
There is only one story in Canadian fixed income this year, and that story is BMO Capital Markets. On the strength of strong gains in estimated market share, BMO Capital Markets has closed the previously precipitous gap between it and the perennial market leader, RBC Capital Markets.
BMO Capital Markets’ impressive gains have come mainly in rates products, in which the firm has joined RBC Capital Markets as a market leader. RBC Capital Markets continues to maintain the dominant position across secondary and new issue investment-grade credit market share and client penetration. However, BMO Capital Markets has made a strong push in secondary credit trading and now takes the second spot in market share, with TD Securities at No. 2 in new issue trading. “In client penetration, market share and overall quality of Canadian institutional investors executing with Canadian brokers across fixed income, the trio of RBC, BMO and TD is starting to separate themselves from the pack,” says Greenwich Associates consultant Peter Kane.
Electronic Trading
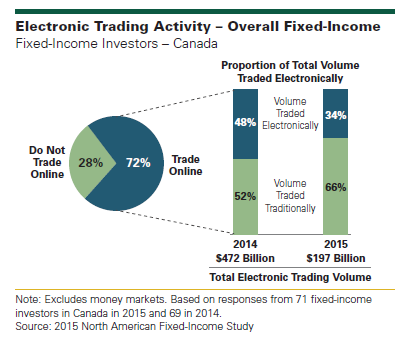
Fixed-income dealers that had been winning market share from the top Canadian dealers on the basis of strong electronic-trading performance saw that momentum
stall over the last year. There were two main reasons:
- Canadian dealers as a whole—and the leading firms in particular—have stepped up their own games when it comes to e-trading. An increase in commitment to electronic trading overall has helped the leading dealers fend off new rivals and even win back some previously lost market share.
- The pace of growth of e-trading activity slowed over the last 12-month period—and might have even declined slightly from the previous year.
“The decrease in e-trading volumes following previous years of robust growth is almost certainly temporary and likely attributable to the general slowdown in trading volumes in Canadian government bonds among hedge funds and other particularly active institutional traders,” says Peter Kane.
Greenwich Share and Quality Leaders
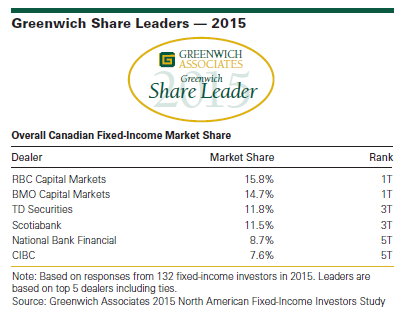
In first place, BMO Capital markets and RBC Capital Markets are locked in a statistical dead heat, with market shares in overall fixed income of 14.7% to 15.8%. TD Securities and Scotiabank are next, tied with market shares of 11.5% to 11.8%, followed by National Bank Financial and CIBC, which are statistically tied with market shares of 7.6% to 8.7%. These firms are the 2015 Greenwich Share Leaders in Overall Canadian Fixed Income.
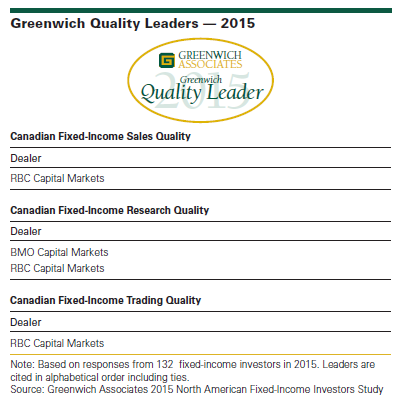
When it comes to quality, RBC Capital Markets is still king. Greenwich Associates asked the 132 investors participating in its 2015 Canadian Fixed-Income Investors Study to name the dealers they used in a range of fixed-income products and to estimate the amount of trading business allocated to each dealer. Investors were also asked to rate the quality of these dealers in a series of product and service categories. Dealers that received quality ratings topping those of competitors by a statistically significant margin were named Greenwich Quality Leaders.
RBC Capital Markets is a 2015 Greenwich Quality Leader in all three categories of Fixed-Income Sales, Research and Trading. As in market share, BMO Capital Markets has made significant advances in quality ratings over the past year and earns a spot as a 2015 Greenwich Quality Leader in Fixed-Income Research. “Also notable for its improvements in quality over the past 12 months is TD Securities,” says Peter Kane.
Consultant Peter Kane advises on fixed-income markets in Canada.
MethodologyBetween February and May 2015, Greenwich Associates conducted 132 interviews with institutional investors active in fixed income in Canada. Interview topics included trading and research activities and preferences, product and dealer use, service provider evaluations, market trend analysis, and investor compensation.
The findings reported in this document reflect solely the views reported to Greenwich Associates by the research participants. They do not represent opinions or endorsements by Greenwich Associates or its staff. Interviewees may be asked about their use of and demand for financial products and services and about investment practices in relevant financial markets. Greenwich Associates compiles the data received, conducts statistical analysis and reviews for presentation purposes in order to produce the final results.
© 2015 Greenwich Associates, LLC. All rights reserved. No portion of these materials may be copied, reproduced, distributed or transmitted, electronically or otherwise, to external parties or publicly without the permission of Greenwich Associates, LLC. Greenwich Associates®, Competitive Challenges®, Greenwich Quality Index®, and Greenwich Reports® are registered marks of Greenwich Associates, LLC. Greenwich Associates may also have rights in certain other marks used in these materials.
The Greenwich Quality LeaderSM and Greenwich Share LeaderSM designations are determined entirely by the results of the interviews described above and do not represent opinions or endorsements by Greenwich Associates or its staff. Such designations are a product of numerical scores in Greenwich Associates’ proprietary studies that are generated from the study interviews and are based on a statistical significance confidence level of at least 80%. No advertising, promotional or other commercial use can be made of any name, mark or logo of Greenwich Associates without the express prior written consent of Greenwich Associates.