

It wasn’t long ago that U.S. Treasuries traded in only two marketplaces. Interdealer brokers, using humans or central limit order books (CLOBs), facilitated trades between primary dealers. Primary dealers, whether with humans or via request for quote (RFQ), facilitated trades between their balance sheets and global investors. The bifurcation was easy to understand and existed to accommodate the different trading needs of the parties involved in each market.
With the advantage of hindsight, we now know that those markets were woefully inefficient. To be fair, the U.S. Treasury market of 2006 was certainly more transparent and efficient than the Liar’s Poker market of the 1980s. The post-financial crisis market of the early 2010s was still more efficient. Furthermore, the average daily volume in 2001 was $298 billion—less than half of the $600 billion average in 2021 and an even smaller fraction of the nearly $1 trillion traded in a single day in September of 2022.
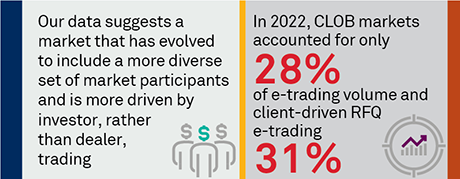
Despite this march forward, however, more efficiency can still be found. The RFQ model, albeit an increasingly automated and sophisticated RFQ, is still the most used, handling 32% of U.S. Treasury volume in September 2022. And CLOB markets, while now open to the buy side, still remain largely the realm of market makers, despite the growing influence of asset managers on market activity. While we do not have the luxury of recreating the market structure from scratch, knowing what we know today, innovative technology and a little help from regulators suggest the next step is upon us.
MethodologyCoalition Greenwich interviewed 34 U.S. Treasury investors between Q4 2021 and Q1 2022, and 40 in a separate study in the second half of 2021. Via Greenwich MarketView, Coalition Greenwich aggregates and analyzes U.S. Treasury trading data on a monthly basis from FINRA, the Federal Reserve, the major trading platforms, and other data sources to calculate electronic trading levels, trading protocol usage and platform market share. This report uses that data through September 2022.