


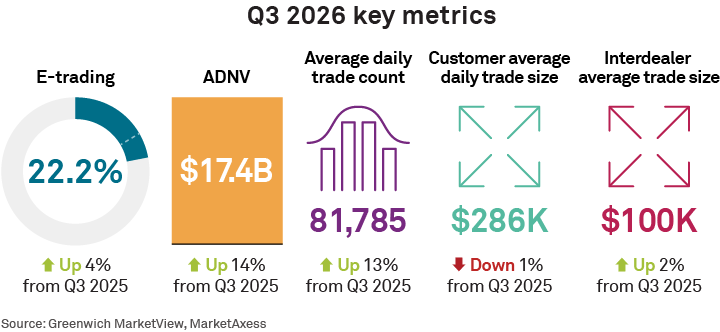
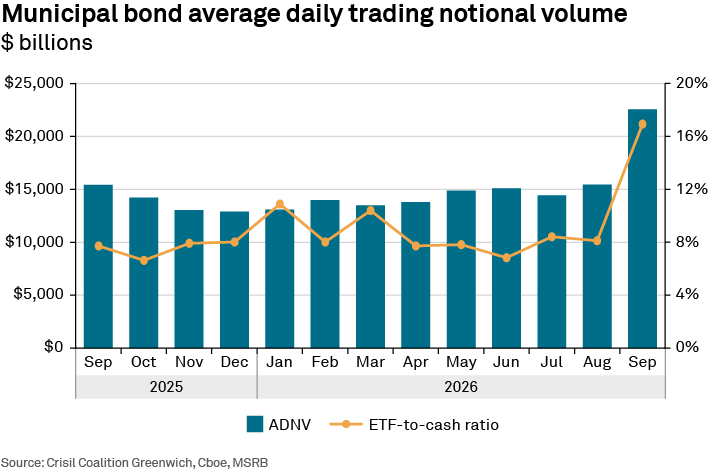
Rising interest rates in September drove an explosion in municipal bond trading as investors embraced the tax-loss harvesting opportunity. Munis were sold to lock in the losses for tax purposes with those proceeds then used to buy similar bonds to maintain market exposure. The average daily notional volume (ADNV) in the third quarter was up 14% year over year, and September volumes grew an impressive 46%. The volume jump was so high that we wondered if the data was correct—it was. October’s volume was even more impressive, starting off Q4 with a bang.
Muni ETFs step up
The role of exchange-traded funds in the market’s reaction to higher rates also reached record territory. While the ETF-to-cash ratio, which measures muni ETF notional volume traded relative to volume in the underlying bond market, did not quite hit record territory in Q3, September saw the highest ETF-to-cash ratio ever, at 17%. This eclipsed the previous record of 12.3% set in June of 2022 in the midst of the Fed’s now famous rate-hiking cycle. To put this in perspective, the ratio sat just under 2% in 2019. Munis are now closing in on corporate bonds, where the cash-to-futures ratio for investment-grade corporate bonds was 11% in September, while the ratio for high-yield was 38%.
Tax-loss harvesting also played a big role in the ETF activity. Data from Morningstar shows muni mutual fund outflows of $11 billion in September and muni ETF inflows of $14 billion. While the data doesn’t definitively prove that the mutual fund outflows went straight into ETFs, it doesn’t take much of a leap to understand why investors would want to use the opportunity to sell mutual funds and move into lower-cost ETFs. Add that dynamic to the ETF/bond arbitrage trade, create-redeem process and investor demand for muni ETFs in general, and the strengthening link between ETFs and bonds is clear—a link that did great things for corporate bond liquidity.
Electronic trading
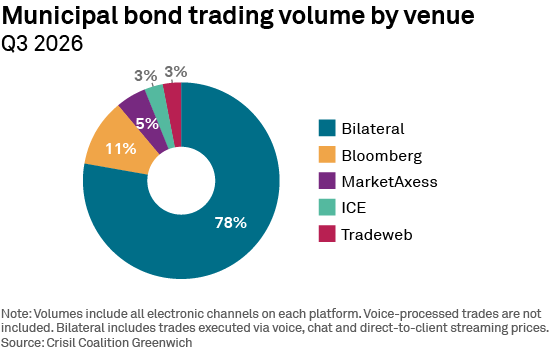
Electronic-trading solutions supported and made possible the massive risk transfer of September and October. E-trading hit another record in Q3 of 22.2%, up from 18.4% in Q3 2025. E-trading handled 23% of September’s volume, an all-time high, with all four major trading venues hitting their own records that month. Bloomberg’s focus on institutional clients and its wide range of protocols saw its overall share top 50% of e-trading (and 11% of total volume), with institutional clients generally executing larger trades that quickly impact notional-weighted market share calculations. The big retail presence in the muni market (and the tax-loss harvesting trade) also drove heavy turnover at ICE and Tradeweb, where trade counts are high and trade sizes smaller.
The growth in e-trading coupled with the pending consolidation of ICE and MarketAxess paints the picture of a market ripe for increased competition. While the existing platforms and startups like OpenYield compete fiercely with one another for liquidity, eyeballs and automated market makers, the 78% of the market traded bilaterally is where the biggest growth opportunity resides.
Streaming prices
Dealers sending continuous bond prices directly to clients who can then click to trade is an increasingly large segment. While pinning exact volume numbers down is still difficult, it is possible another 5% or more of volume is executed through these channels. Some of this is directly between a dealer’s pricing engine and a client’s execution management system. More use the plumbing of muni-specific trading solutions such as Investortool’s Perform platform.
The rest of the market is traded via phone calls and electronic messaging. It is always important to remember that the municipal bond market is a regional market by definition. That means that regional dealers have relationships with regional issuers, both of whom look to investors in the same region who either understand what they’re investing in, need to focus within their own state for tax purposes or both. Electronifying that flow is complex. Even those smaller, local transactions can be done more efficiently through today’s order-matching technology. But not everyone wants an easier method if they feel it works fine enough as is (and pays the bills). Nevertheless, it was only 30 years ago that many thought stock couldn’t trade without a centralized trading floor—and here we are.
Market Structure & Technology Head of Research Kevin McPartland and Neha Jain are coauthors of this report.
The data underlying this analysis, which includes but is not limited to e-trading levels, platform market share and total market volumes, is available to subscribers of Greenwich MarketView. MarketView provides continuous access to these metrics, updated at least monthly, based on the frequency of the source data.

Crisil Coalition Greenwich continuously gathers data and insights from municipal bond market participants, including market makers, primary dealers and trading platforms. The data, once aggregated, normalized and enhanced, is analyzed by our market structure research team, who identify the key trends of trading in the muni markets, with a focus on muni bond electronic trading and trading platform market share.