

Table of Contents
Executive Summary
During the onset of the COVID-19 pandemic, between late February and early April 2020, the U.S. capital markets experienced unprecedented volumes and volatility, with various records being broken across multiple asset classes. Investors, both of the retail and professional variety, looked at the markets with some amount of shock and awe.
Equity markets witnessed repeated sharp selloffs, only to gradually regain their lost ground. U.S. Treasuries yields spiked before declining to record lows. Derivative volumes skyrocketed before dropping to below average levels. Strained conditions in debt and funding markets ultimately motivated drastic intervention by the Federal Reserve.
Overall, however, the story of the U.S. capital markets during the COVID crisis has been one of remarkable resiliency of the trading systems, market infrastructure and the professionals that collectively continue to make the U.S. capital markets the most efficient and liquid in the world. This resiliency ensured that markets delivered on their key objectives:
- Facilitating the price discovery process to set new, properly informed price levels
- Allowing market participants to transfer or hedge risk
- Enabling consumers, private sector and public sector entities to access cash and secure financing
This Greenwich Report takes a data-driven approach to examine more closely exactly what happened during the most acute phase of the COVID-19-induced market turmoil. We analyze activity in the equity, equity options, interest rate (i.e., U.S. Treasury, repo), credit (i.e., corporate bonds), swaps (i.e., IRS, CDS), and FX markets—all of which were impacted by and reacted differently to the onset of the pandemic.
Simultaneously exploring how conditions and activity evolved across asset classes is essential to understanding the strengths and weaknesses of the current market structure. Not one of those markets operates in a vacuum, and we hope this analysis provides additional insight into their interrelated nature and the future of capital markets.
Equities
Executive Summary
U.S. equity markets are widely recognized as the most efficient in the world, with deep pools of accessible liquidity, a well-established market data regime and a sound and predictable regulatory framework.
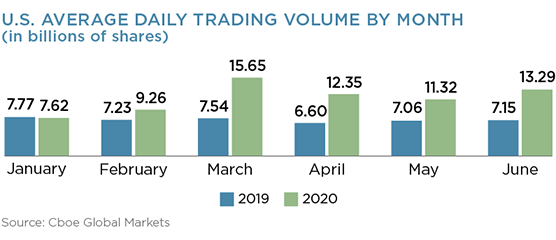
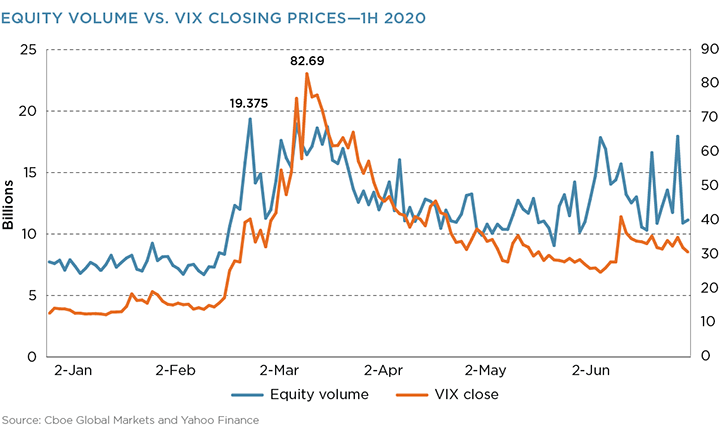
Throughout 2019, average daily volumes in the U.S. equities markets topped just over 7 billion shares per day. Meanwhile, during the fourth quarter, the VIX, an index of market-wide expectations of future volatility, had an average close below a fairly benign price of 14. The new year began closely in line with 2019, with volumes over 7.5 billion shares and the VIX hovering near 14. However, the onset of the COVID-19 pandemic, and the attendant significant uncertainty regarding the ultimate micro- and macroeconomic fallout, delivered a series of significant market shocks.
This paper is the first in a series of four examining U.S. capital markets at the onset of the COVID crisis. In order of publication, these reports will provide a detailed look into the performance of the equities (including options), fixed income (U.S. Treasuries and credit), global interest-rate derivatives, and foreign exchange markets during the crisis in the first half of 2020.
Record Volumes
On February 24, 2020, U.S. equity markets began a precipitous fourweek decline, punctuated by a series of dramatic drops and rebounds. Throughout the ensuing weeks, the markets would be tested across a number of different facets.
Equity market volumes in March were staggering, and these elevated volumes persisted through the rest of the first half of 2020. The second highest volume day in history occurred on February 28, 2020, with 19.375 billion shares traded.1
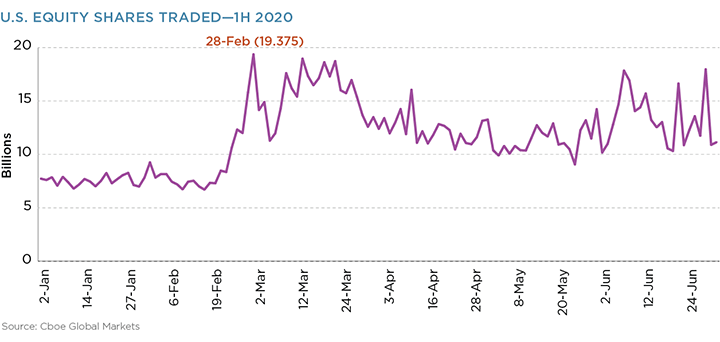
These sharply elevated daily volumes are particularly noticeable when compared to the same period in the year prior, with March year-over-year volumes more than doubling and remaining significantly elevated throughout 1H 2020.
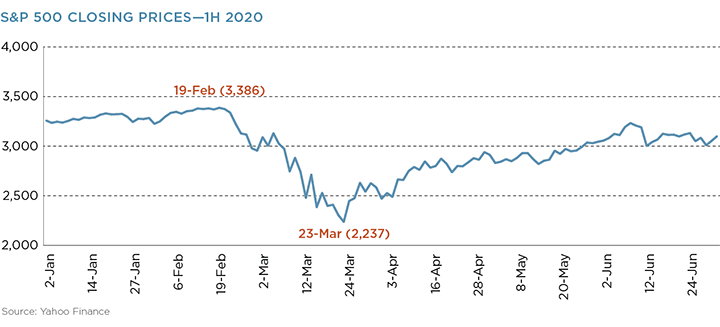
March’s record trading volumes reflected a diverse array of market participants expressing their countervailing views and analyses to establish new, informed price levels. This activity led market prices to their low on March 23, 2020. During the first half of 2020, the S&P 500 peaked at 3,386 on February 19 before dropping to a low of 2,237 on March 23—a drop of almost 34% in just over a month of trading.2
Volatility
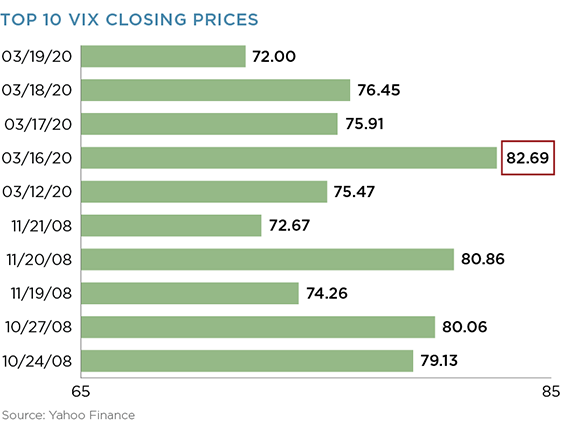
The significant uncertainty and related volatility in the market during this timeframe is best reflected by the significant movements in the VIX. As mentioned earlier, the VIX opened 2020 very much in line with the end of 2019. However, at the end of January, the VIX began a precipitous escalation, closing over 40 by the end of February. Within weeks, it doubled again to reach an all-time high of 82.69 on March 16. Interestingly, of the top 10 VIX closing prices, five occurred in March 2020 and the other five during the 2008 global financial crisis.
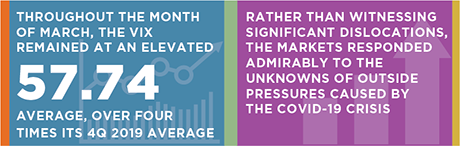
Throughout the month of March, the VIX remained at an elevated average of 57.74, over four times its 4Q 2019 average. At the end of 1H 2020, the VIX was still over two times 2019 levels.
Market Safeguards
During the course of March 2020, a number of thoughtful and premeditated market safeguards were activated and functioned as intended. These included the 1) market-wide circuit breakers, 2) Limit Up-Limit Down mechanism and 3) alternative uptick rule.
As equity markets experienced sharp downside corrections, the market-wide circuit breakers (MWCB) were triggered—not once, but four times in the space of less than eight trading days. First, on March 9 immediately after the open, then on March 12 and 16 shortly after the open, and again on March 18 during afternoon trading. Each time, the markets hit the downside 7% limit (see callout box below), paused for 15 minutes and then reopened in an orderly fashion. The MWCBs functioned as designed during March 2020, and trading venues and market participants were able to resume trading in a smooth and efficient manner.
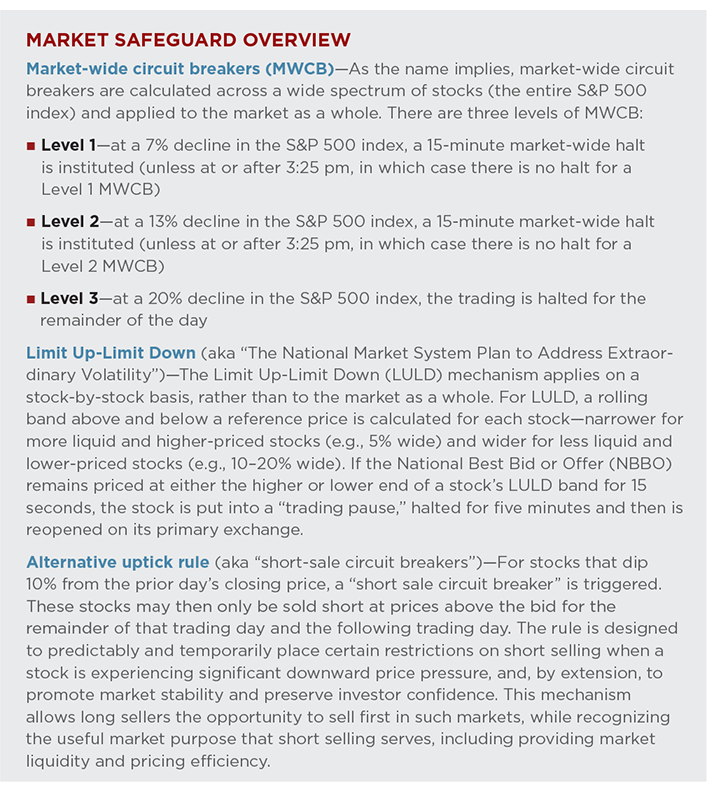
Similarly, individual stocks hit their Limit Up-Limit Down (LULD) halts. On a typical trading day, there are generally only a low double-digit number of LULD halts. On the four days in March when MWCBs were triggered, however, several hundred (and nearly 1,500 on March 18) individual stocks triggered LULD halts. Again, even though a large number of individual securities entered LULD status, overall trading in the market remained orderly.3
The U.S. equity markets also feature a “short-sale circuit breaker” on stocks that experience a decline of 10% from the prior day’s closing price. In general, these short-sale circuit breakers are triggered on a relatively small number of stocks per day. For example, for the month of December 2019, the NYSE equity exchanges published a total of 505 stocks in their daily lists that were subject to these restrictions. In March 2020, however, the NYSE equity exchanges published 21,304 stocks in the same daily lists. Even with the significant increase in the number of stocks subject to the short-sale circuit breakers, trading remained orderly and resilient in the market.
Resiliency of Market Infrastructure
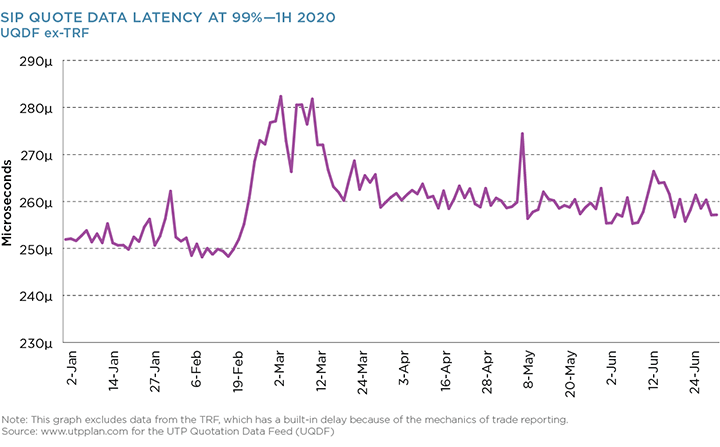
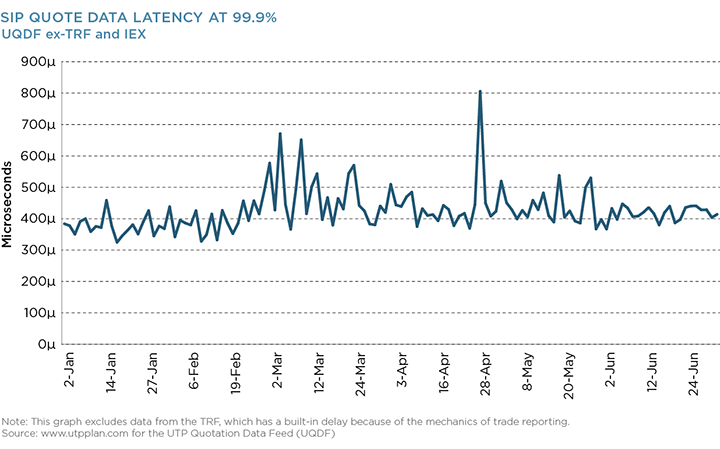
The U.S. equity market is underpinned by the timely dissemination of comprehensive market data, which is the lifeblood of trading. In active and volatile markets, it is essential for accurate market data to be disseminated on a fair and equivalent basis. Data shows that the Securities Information Processors (SIPs), which much of the public uses for their trading, handled the elevated volumes and volatility of 1H 2020 admirably. For example, the SIP that processes Nasdaq data maintained remarkably tight performance bands on both the 99% and the 99.9% microsecond latency metrics, even during the heights of market volume and volatility.4
Off-Exchange Trading Volumes
March 2020 also witnessed a change in the ratio of volume executed on-exchange vs. off-exchange. This can be measured by the amount of volume reported through the Trade Reporting Facilities (TRFs) run by Nasdaq and NYSE. The TRFs capture activity conducted via alternative trading systems (dark pools), market-maker internalization, internal matching by central risk books, as well as single-dealer platforms. In simple terms, everything that does not print on an exchange (whether that order on the exchange is lit or dark) is printed to a TRF.
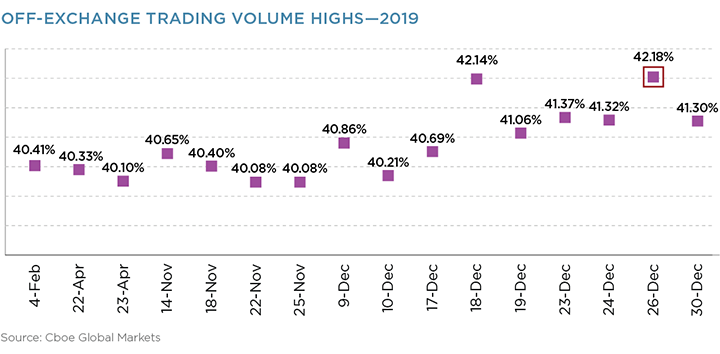
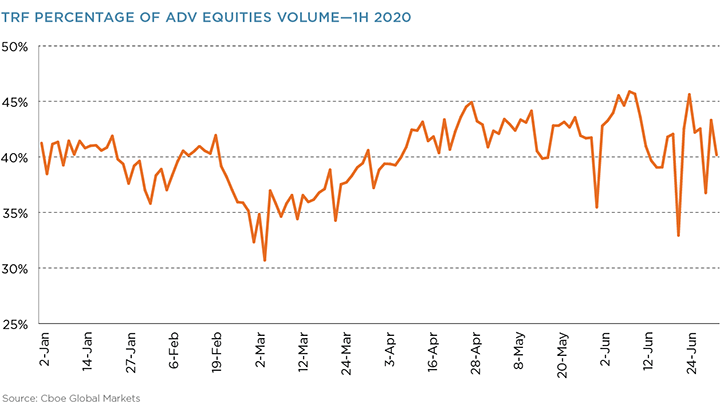
In 2019, off-exchange trading reported to the TRFs remained relatively stable, hovering mostly between 35% and 40% of overall equity market ADV, with a strong trend upward toward 40% and above near the end of the year. In all of 2019, there were 16 days with TRF volume above 40%, with the high of 42.18% on December 26.
The volume printed to the TRFs in early 2020 started off very similar to 2019, ranging from a low of just under 36% to a high of just under 42%. However, that high in mid-February was followed by the sharp sell-off at the onset of COVID-19. TRF volumes initially dropped sharply, falling to a low of 30.70% on March 3, 2020. This may reflect a short-term reaction by traders of routing orders to exchanges at the onset of times of crisis. However, TRF volumes quickly rebounded. By March 16, the TRF volume was above 36% and continued a steady increase. Throughout the first half of 2020, the TRF has already exceeded 40% of equity ADV more than 70 times, reaching highs of over 45% on four separate occasions.
Despite displaying an initial elevated preference for transacting on exchange, market participants quickly realized that the equity markets continued to function well and returned to their prior patterns of routing and trading across different execution venues.
One driver of elevated TRF volumes in 1H 2020 is the internalization of retail order flow by wholesale broker-dealers. Wholesale broker-dealers provide execution services to retail broker-dealers that service retail investors. Instead of routing retail investors orders to an exchange, retail broker-dealers typically route them to wholesale broker-dealers, who provide certainty of execution and price improvement over the NBBO to the order (with the price improvement flowing directly back to the retail trader’s benefit).
As retail volumes have increased following the onset of COVID-19, the amount of order flow that is directed to wholesale broker-dealers has risen. As a result, the increase in TRF volumes (and relative decrease in the percentage of overall volume executed on-exchange) can likely be at least partially ascribed to increased retail activity.
Exchange Metrics
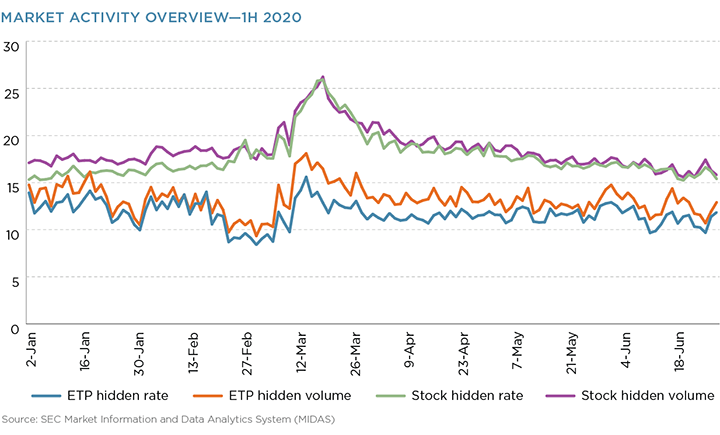
The SEC’s Market Information and Data Analytics System (MIDAS) gives further insight into market behavior in 1Q 2020. First, MIDAS data shows that as the crisis intensified, and shortly after the VIX hit its peak, the percentage of hidden (vs. lit) orders on exchanges also peaked for the quarter. The hidden percentage then started to revert to previous levels but remained elevated through much of 1Q 2020 for both stocks and exchange-traded products (ETPs).5
Second, the trade-to-order volume percentage for stocks hit its high in mid-March, before reverting back toward normal levels near the end of the quarter. On the other hand, the cancel–to-trade ratio for both stocks and ETPs was flat to even slightly depressed during the height of the market downturn.
One result of few cancel-to-trade messages may well have been a widening of the spread and lessening of depth of liquidity. Liquidity providers carefully manage risk through their quoting practices. With massive spikes in volatility and volume, a natural response among liquidity providers is to widen their quotes and lower the amount of volume at risk for any particular trade.
Options
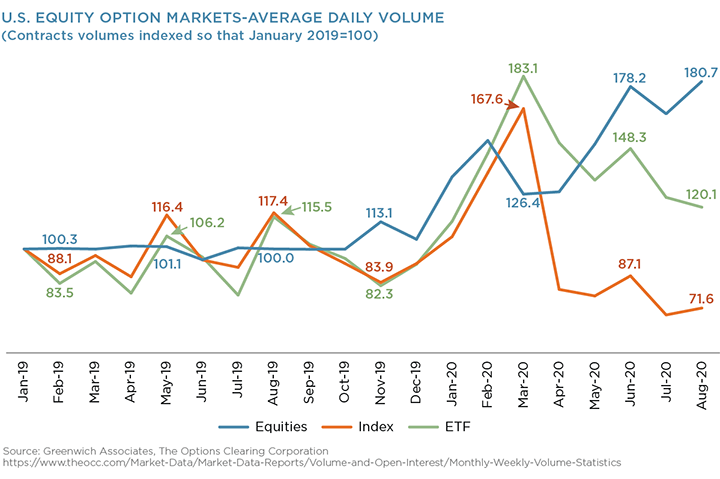
Options volumes similarly exploded, as demands for hedging and volatility products spiked in line with equity market moves and volatility. Options contracts cleared at the OCC rose to 662 million in March from an already elevated level of 557 million in February and representing a more than 50% increase from March 2019. Option contracts on ETFs alone jumped to 303 million contracts from 148 million the year before—over a 100% increase.
The central clearing of options at the Options Clearing Corporation (OCC) serves as a bedrock to the stability and resiliency of the financial system, especially given the sophistication of options as an instrument and the complexity of risk managing them. Further, following the implementation of the uncleared margin rules (UMR) for OTC derivatives, equity total return swaps (TRS) in the interdealer market have been replaced by put-call combos that are cleared at the OCC. This means that the OCC has also played an important albeit discreet role in de-risking the banking system. This role will continue to expand to the buy side as the timeline for full UMR implementation advances. Throughout the March 2020 market turmoil, the OCC operated soundly.
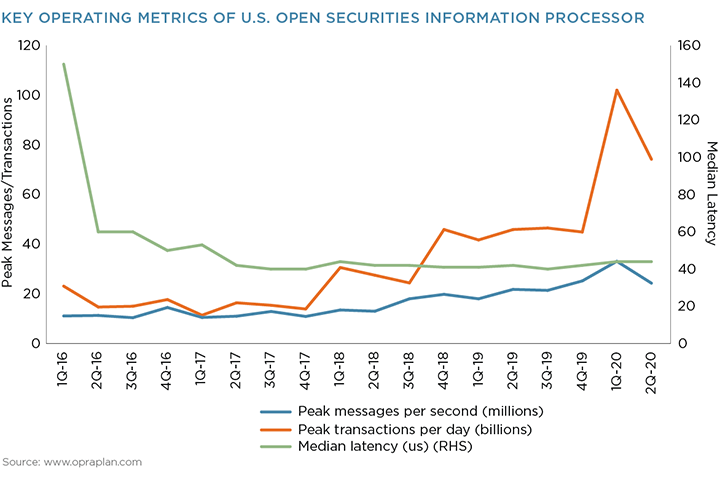
Given the extreme equity market volatility and attendant explosion in equity option volumes, it is worthwhile to highlight the remarkable resiliency of the options market throughout this period. The most robust market data system in the world is the Options Price Reporting Authority (OPRA), which is responsible for publishing real-time market data for options.
For each underlying security, there are many different option expirations and potentially hundreds of strike prices. The data lift and throughput of OPRA is significantly greater than that of the Securities Information Processors (SIPs) in equities.6 Despite the massive spike in volatility, OPRA had 100% uptime throughout the crisis, and in March had a peak message rate of 33 million messages per second, the highest on record and an order of magnitude more than the volume of the equity SIPs. Amazingly, OPRA’s latency in March actually declined from that of February.
Conclusion
In the first half of 2020, the U.S. equity markets experienced record volumes and volatility. This coincided with the largest experiment of migrating to work from home ever experienced by the financial services industry. The remarkable fact is that the U.S. markets did exactly what they were intended to do—bring buyers and sellers together. Through it all, U.S. regulators and officials recognized the importance of keeping the markets open.7
Although prices in the market experienced significant movement, these price shifts were a response to fundamental pressures from marketmoving forces rather than internal miscues of the market systems themselves. Indeed, rather than witnessing significant dislocations, the markets responded admirably to the unknowns of outside pressures caused by the COVID-19 crisis.
Pre-designed regulatory safeguards, which were exercised with greater frequency than anticipated, provided exactly the type of protections to the market they were designed to provide. In unprecedented times, the U.S. equity markets facilitated an orderly and efficient marketplace during the times when it was needed most.

1The highest volume day occurred on October 10, 2008 with 19.761 billion shares traded (in the midst of the 2008 financial crisis). The third highest day was on May 6, 2010 with 19.171 billion shares traded (the “Flash Crash”).
2March 23, 2020 also saw the 1H 2020 lows for the Dow Jones Industrial Average at 18,591.93 and the Nasdaq Composite at 6,869.67.
3Of the 7,845 LULD halts in the month of March, 4,645 were Limit-Up halts, indicative of the turbulence of the market in both directions throughout the month.
4Similarly, the CTA Plan data metrics show very tight measurements at the 99 percentile latency measurement for January through May 2020, with only tens of microseconds of difference (and April having the highest average).
5MIDAS tracks percentages of both hidden trades to total volume and hidden shares to total volume, for stocks and ETPs, all shown on the graph above.
6To give a sense of scale, there are approximately 9,000 stocks listed on the equity exchanges. There are more than a million options which are cleared by the OCC.
7See, e.g., https://www.wsj.com/articles/u-s-rebuffs-calls-to-close-stock-market-11585476000 (March 29, 2020).
Fixed Income
Introduction
Fixed-income markets were at the center of both market volatility in 2020 and the solutions put in place to help the economy and the broader markets recover. Corporate bond markets have seen record issuance, as corporations look to raise much-needed cash and U.S. Treasury markets act as a central tool of the U.S. government’s fiscal stimulus plan.
Both of those markets, and markets adjacent to them, held up quite well in March 2020, despite some hiccups. And while Federal Reserve intervention was ultimately required to calm the panic and put market participants at ease, fixed-income market structure passed its first big test since the credit crisis of 2008.
Part 1: U.S. Treasuries
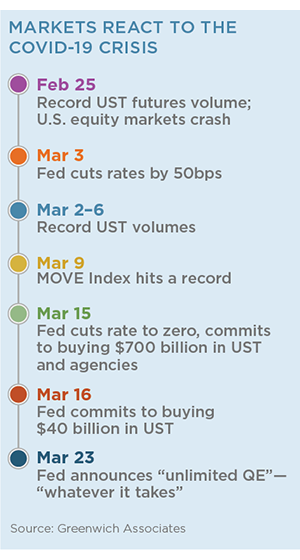
U.S. Treasuries (UST) are widely recognized as the safest and most liquid asset in the world. That distinction has meant that bid-ask spreads and price movements on any given day are generally minimal. These notions were challenged, however, in late February and early March 2020, as UST prices underwent significant swings, equity markets crashed, and global markets went into panic mode. Several metrics and facets of U.S. Treasury market structure must be examined to truly understand what went on in those critical weeks.
Race for Cash
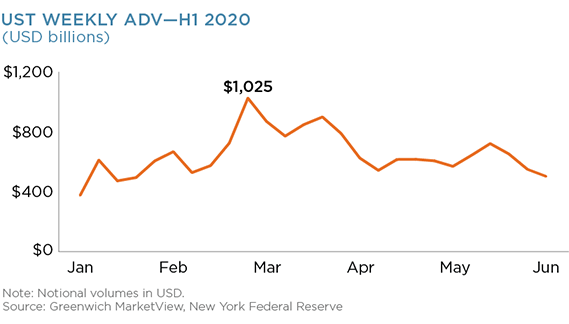
Times of extreme economic stress often drive a flight to quality, which causes UST prices to jump (and yields to decline) while equity prices fall. This was the market’s initial reaction, starting in mid-February, as the pandemic spread and equity markets began their massive sell-off on February 24. This continued unabated through the first week of March, which included the Fed’s first rate cut outside of a meeting since the 2008 financial crisis, driving massive volumes into UST markets—over $1 trillion in notional daily.
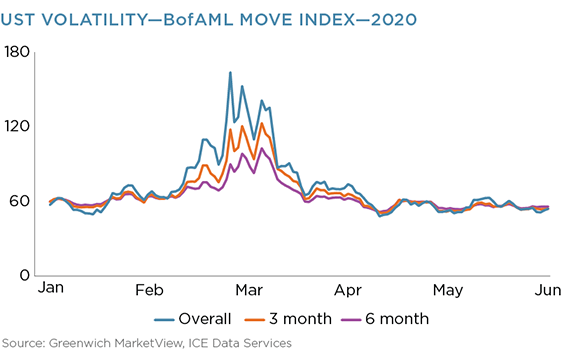
That initial buying quickly turned to selling when, as market conditions quickly deteriorated, market participants raced to raise cash by selling liquid assets—predominantly U.S. government bonds. The ICE BofAML MOVE Index (measuring U.S. Treasury yield volatility) spiked to 164 on March 9, more than triple its value in March of 2019.
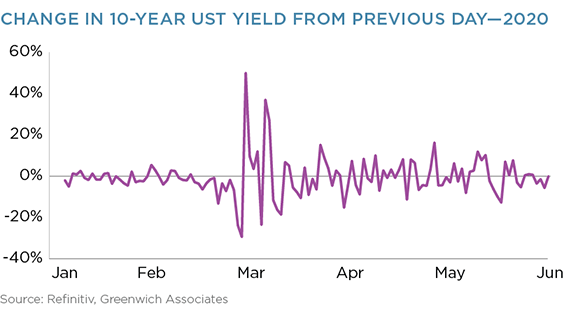
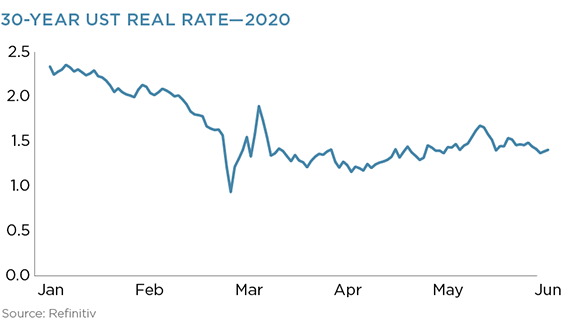
This volatility can also be seen in the huge swings in interest rates, as daily interest rate moves for the 10-year Treasury were in some cases over 60%, which is unheard of in a market where a few basis points (one hundredth of a percent) can be significant. Further, 30-year rates hit record lows in March, briefly going negative, only to swing upward by nearly 100 bps in the few days that followed.
A strong and sudden need for cash by market participants, central banks and corporations all around the world played a huge part in the selling and volatility. The universal uncertainty surrounding the pandemic’s impact on global markets signaled cash flow issues would quickly arise. Volatile markets created unexpected margin calls for investors, while businesses forced to close their doors still had bills to pay despite a steep revenue cliff.

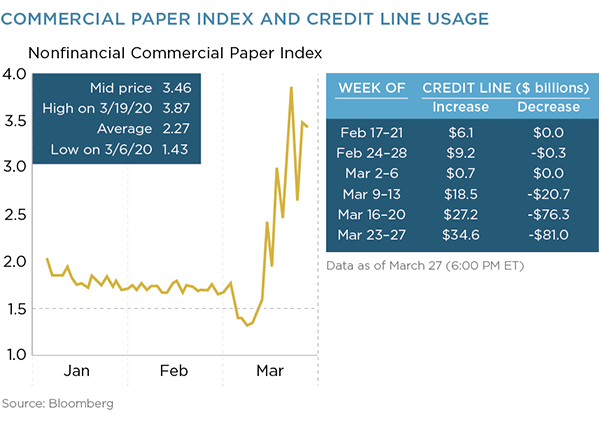
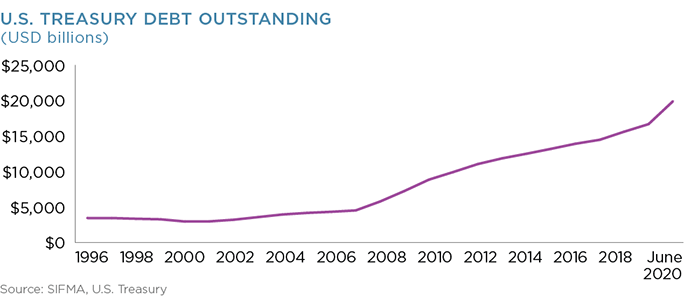
Much of that cash came from the sale of U.S. Treasuries and from borrowing in the repo market, which put additional pressure on both markets. Furthermore, drawdowns of corporate revolving credit lines jumped dramatically throughout March, hitting over $80 billion by the end of the month. As a backdrop to the forced selling, central banks around the world saw the inevitability of short- and long-term massive fiscal stimulus driving up supply beyond its already high levels. As of June 2020, U.S. Treasury securities outstanding were up 19% from January 1 and have more than quadrupled since 2007.
Fed Intervention
Then the N.Y. Federal Reserve stepped in. First, it cut interest rates to near zero only two weeks after its last cut of 0.5%. Second, and more dramatically, it announced it would do “whatever it takes”1 to stabilize markets. In other words, the Fed stepped up its existing commitment to buy $700 billion of UST and agency securities and committed to just keep buying until markets calmed down.
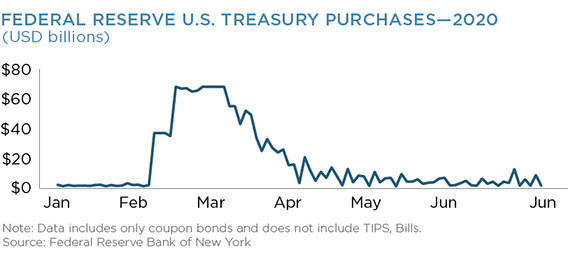
And buy it did. In the months leading up to March 2020, the Fed committed to markets that it would buy $20 billion of UST per month. On March 16, the Fed committed to buy $40 billion that day. The daily buying continued, peaking at $75 billion per day from March 19 through April 1 and then slowly declined from there.
Trading Activity
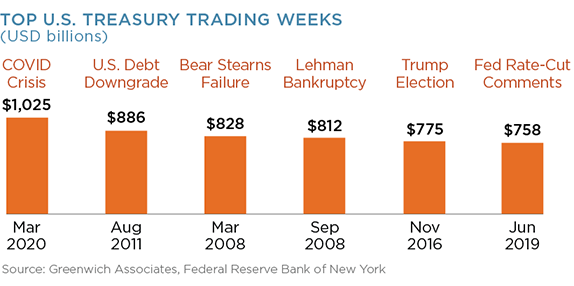
The average daily volume (ADV) for the week ending March 6 was $1.025 trillion per day (including coupons and bills, but not TIPS)—a record and 80% higher than the average daily volume in 2019. As an illustration of how extraordinary trading was at the onset of COVID-19, the volume was also 15% higher than the previous record, $886 billion per day, set in August 2011 when the U.S. had its debt downgraded, and 20% higher than the $812 billion traded per day during the week Lehman Brothers declared bankruptcy.
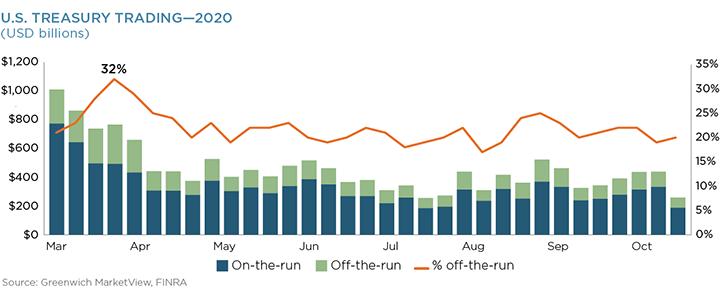
Market participants selling to raise cash also created a temporary jump in the relative amount of off-the-run UST traded through March and April. Much of this was driven by foreign entities (i.e., central banks, sovereign wealth funds, etc.) that are collectively large holders of U.S. Treasury securities in general and off-the-runs more specifically. As of June 2020, 30% (roughly $6 trillion) of U.S. Treasury securities outstanding were held by Asian and European entities. Whereas off-the-runs accounted for 23% of volume the week of March 2, in line with historic averages, it peaked at 35% the week of March 23 and then remained at 30% or above through the week of April 13.
Repo and Futures
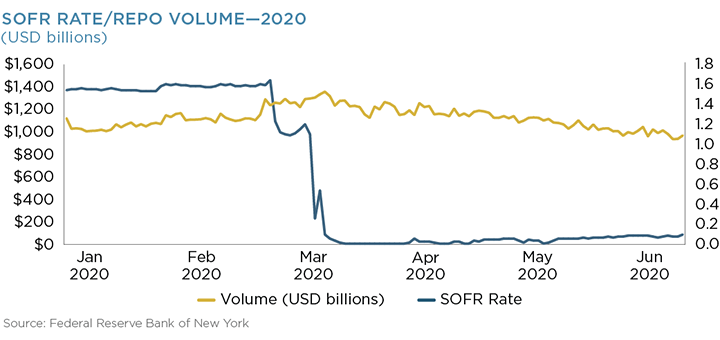
Repo volume also jumped in March, with volume hitting a high-water mark of $1.358 trillion on March 18, up 17% from the same day a month before. This volume coincided with Fed rate cutting that also drove down the secured overnight funding rate (SOFR) from an average of 1.54% (from January 1 through March 3) to 0.01% on March 24—an incredible drop in percentage terms for an overnight funding rate.
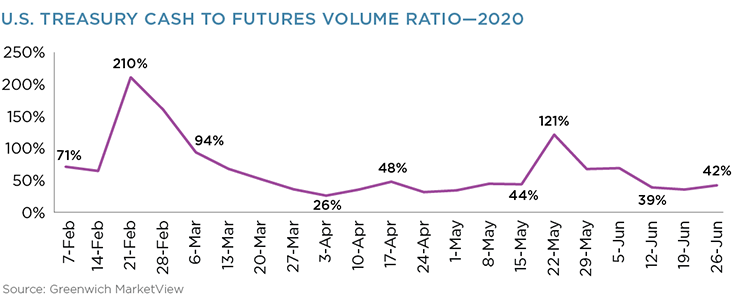
UST futures volume spiked earlier, on February 25, trading nearly 25 million contracts that day. However, as cash market activity and volatility picked up, the link between cash and futures markets began to diverge from historical norms. While UST volume grew as market participants worked to raise cash, futures volumes did not follow suit. Whereas futures trading equated to 49% of UST trading on a notional basis in April of 2019, it equated to only 35% in April 2020, hitting its low point the week of April 3 at 26%.
Electronic Trading
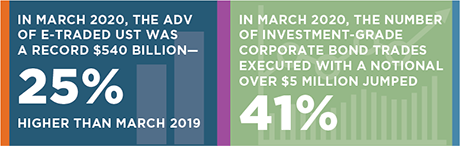
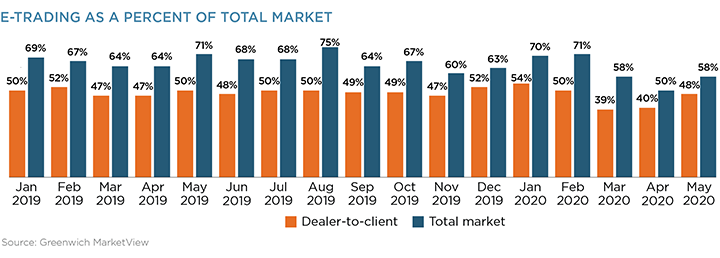
In March 2020, the ADV of electronically traded UST was $540 billion—a record and 25% higher than the same month the year before.

Relative to total market volume, the record month for e-trading represented a slight decline from the year before, accounting for 59% of market volume compared to 62% in March 2019.
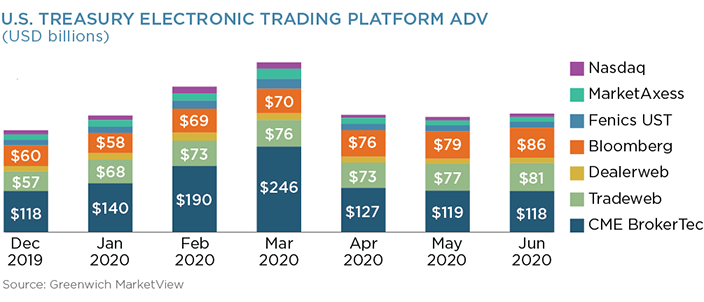
Central limit order book (CLOB) markets, particularly CME BrokerTec, saw the biggest volume surges in March 2020, with an ADV of $313 billion compared to $222 billion in March 2019. While bid-ask spreads did widen and sizes offered at the top of the booked declined over some periods, the level of activity in this market (which is commonly used to set the benchmark price) remained robust during the peak of the crisis.
April saw CLOB volumes drop off relative to other execution methods as total market volumes declined. Conversely, client activity began to pick up again primarily through request-for-quote (RFQ) platforms, such as Bloomberg and Tradeweb, returning to normal levels by May.
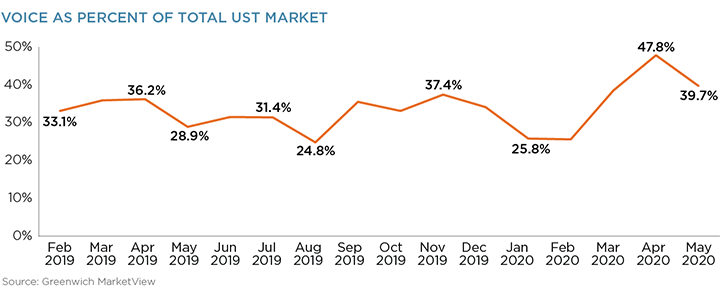
Clients, however, traded slightly more volume via manual channels on a relative basis, such as phone and instant message, than they did during the same period last year. Such bilateral/voice trading accounted for 38% of volume in March and nearly 48% of volume in April, compared to 36% in both March and April of 2019. It is important to remember, however, that the absolute volume traded through electronic channels still hit record levels despite the relative uptick in phone-based trading.
The data suggests that the changes in trading protocol usage both during and immediately following the acute phase of the market crisis were due largely to the shifting demographics of active market participants and the change in the makeup of actively traded products. For instance, off-the-runs have traded via voice more often than on-theruns historically. As such, the jump in off-the-run activity would find more of the market volume on a relative basis traded on the phone. Similarly, while real-money asset management activity grew and smaller quantitative fund activity declined, RFQ and CLOB volumes would shift accordingly.
Conclusion
The relative decline of off-the-run trading and a normalizing of the futures-to-cash ratio in May coincided with an overall decline in volume, as markets finally calmed. Market activity through the first half of 2020 has remained close to historical averages. For instance, the ADV for May and June of 2020 is only 5% higher than it was in 2019—a somewhat negligible move looking at market changes over time. Unexpected news will inevitably create volatility (and volume) spikes for the foreseeable future, but given the Fed’s explicit guidance as to the direction of markets, UST markets are likely to continue on solid footing.
Part 2: U.S. Credit
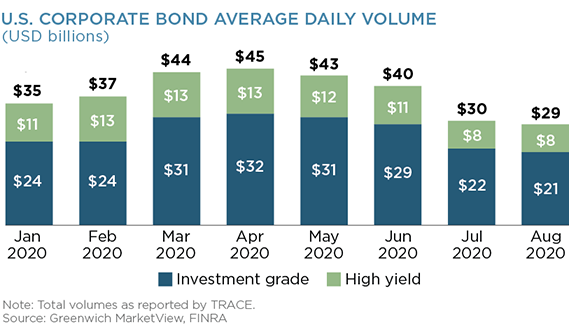
Concerns related to expected economic fallout from the pandemic were the most significant trigger of unease about credit quality and credit exposure, according to Greenwich Associates research. As a result, activity in the U.S. credit market jumped markedly in March and April 2020. According to TRACE data, $44.6 billion and $44.9 billion of corporate bonds traded in March and April respectively. That equates to a 30% increase from March 2019, with a 22% increase for investment-grade (IG) bonds and a 50% increase for high-yield (HY) bonds. Volumes on March 31 and April 30 jumped even higher, with $62.3 billion and $65.3 billion of IG and HY bonds trading on each of those days respectively.
Liquidity
Other notable day-over-day volume jumps occurred on March 23–24 and April 9–10, when the Fed announced its corporate bond-buying program (March 23) and willingness to buy “fallen angels” (April 9). Changes in the bid-ask spread for IG bonds provide a likely explanation for both Fed intervention and its result. Observable bid-ask spreads (which come primarily from electronic trading platforms and do not include prices quoted by dealers directly to clients) from the start of 2020 through February 21 averaged $0.16 wide (in relation to par). By March 23, that same average jumped a staggering 1,113% to $1.94. The following day, after the Fed stepped in, spreads immediately started to decline.
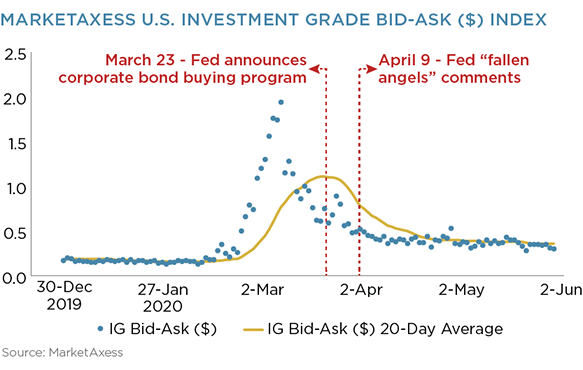
The average bid-ask spread in May and June, $0.37, is still higher than pre-pandemic, but reflects ongoing market uncertainty, which liquidity providers account for in their quoted spreads.
Block trading in corporate bonds, particularly IG bonds, also grew starting in March and remained elevated at the end of the first half of the year. The number of IG trades executed with a notional over $5 million jumped 41% from February to March 2020 and 14% from March 2019 to March 2020.
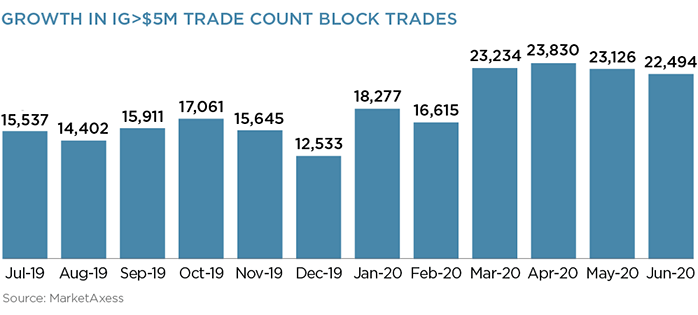
The market’s propensity to trade in larger sizes continued through June. The average number of trades in the greater than $5 million category from March through June 2020 is 27.5% higher than in the same period last year. However, as overall market activity calmed in the summer months, so did trading in block sizes.
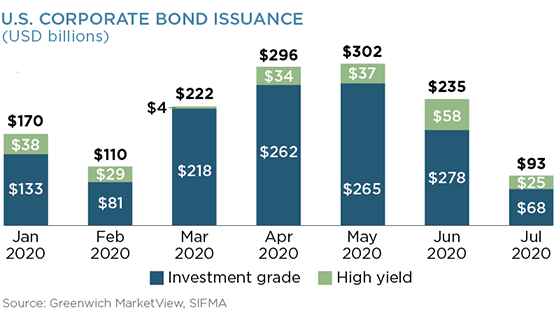
New Issuance
The sudden need for cash by corporations, further spurned on by rockbottom interest rates as well as the Fed’s promise to buy corporate debt, drove a huge surge in new issuance as the market stabilized heading into April. New issuance of IG and HY corporate bonds in the first half of 2020 was more than double the same period in 2019. Despite a slight slowdown in early summer, it is likely that the same factors listed above will continue to drive elevated levels of new issuance through at least the end of 2020. Ultimately, there continues to be sufficient demand from investors to buy these new bonds, with the Fed’s role in primary market purchases relatively limited, as the search for yield accelerated amid UST rates remaining at historic lows.
Electronic Trading
Electronic trading also held up remarkably well through the volatility and volume surges in March and April 2020 and through the rest of the first half of the year. Twenty-five percent of IG volume was traded electronically in March 2020. This is up from 22% in March 2019.

While e-trading declined month-over-month from February to March 2020 on a relative basis, the absolute volume traded electronically was a record at the time—$9 billion per day. That record volume was eclipsed two months later in May 2020 when approximately $10.3 billion traded on average each day. The first half of 2020 ended with the percentage of HY bonds trading electronically at a record, and IG only 1% below the previous record set in December 2019.
MarketAxess was the biggest beneficiary of market activity in March 2020, as market participants directed their electronic liquidity-seeking efforts to the largest U.S. platform by volume. RFQ markets were most utilized while other auction-based protocols struggled, as it became more difficult to agree on a mid-point price to cross trades. MarketAxess’s OpenTrading platform, an anonymous RFQ protocol, also saw a huge jump in activity, accounting for 31% of the platform’s total volume in the first quarter of 2020 compared to 26% in the same period the year before.
Tradeweb’s tool to process voice trades also grew in popularity in March, as voice trading picked up amid the market uncertainty. Tradeweb processed $2.5 billion of trades in February 2020, $3 billion in March and nearly $3.5 billion in April. While not electronic trading per se, the efficiency it brought to an otherwise manual market was needed and leveraged, particularly as traders began working from home.
Lastly, Trumid saw solid activity starting later in March as new issuance began to surge. Trumid has proven a relatively popular tool for trading in new issues anonymously, something that became even more useful as new issuance in April was three times as high as it was only two months prior.
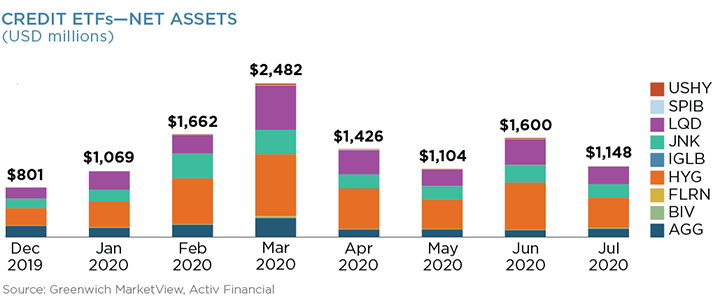
ETFs
ETF trading activity at the onset of the COVID-19 pandemic was also remarkably robust. The nine corporate-bond-tracking ETFs monitored by Greenwich MarketView saw their trading volumes jump 50% between February and March 2020.
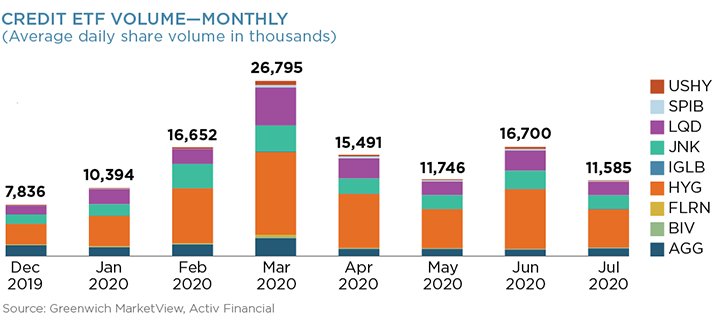
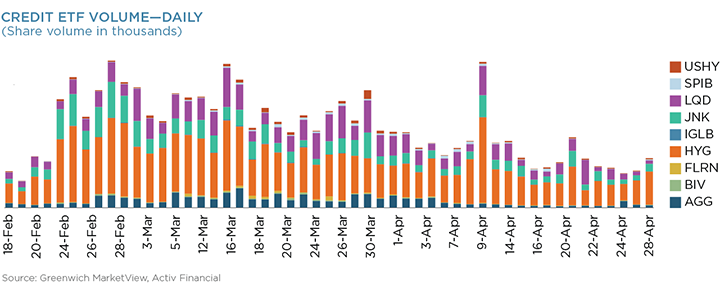
Interestingly, the announcement that the Fed would buy ETFs on March 23 did not have a dramatic impact on volumes, but when the Fed announced it would buy high-yield ETFs on April 9, volumes more than doubled from the day before, driven by issues such as HYG and JNK.
Despite concerns about ETFs trading first at a discount to NAV and then at a premium, ETF prices ultimately proved to be a leading indicator of where bond prices were headed. ETFs allowed investors to hedge and obtain directional exposure, especially where underlying cash markets struggled to price individual names.
Credit Default Swaps
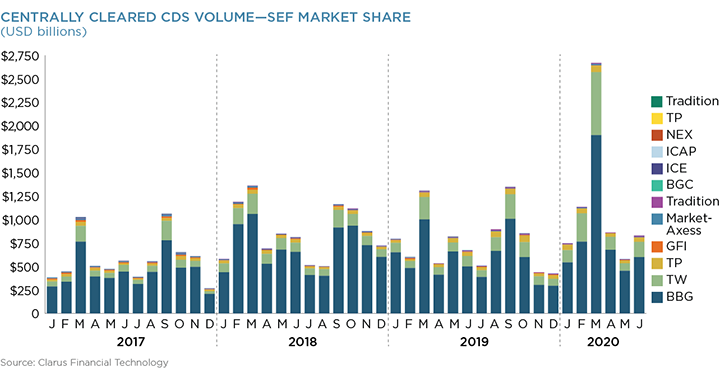
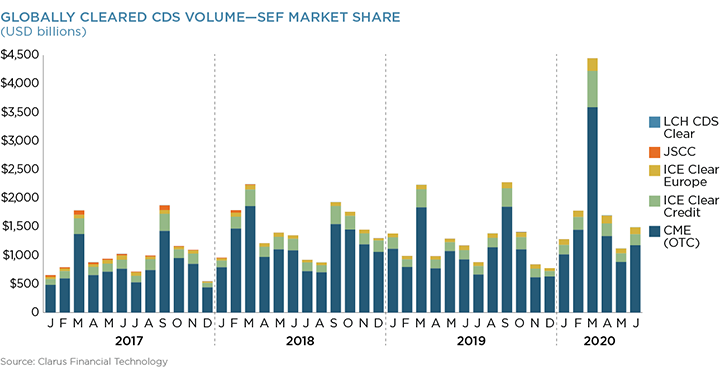
CDS volumes also jumped in line with corporate bond and ETF volumes. Both index and single-name CDS volumes nearly doubled in March compared to February, as expectations for default changed quickly for both high- and low-rated names. Globally cleared CDS volumes more than doubled over March 2019 levels. Swap data repository (SDR) information indicates that 89% of CDS volume was executed on a swap execution facility (SEF), which is in line with recent history. This trading in the centrally cleared market was dominated by Tradeweb and Bloomberg.
Conclusion
The U.S. credit market was put to its biggest test since the 2008 financial crisis—and by most measures, it passed. Electronic trading, fixed-income ETF assets, as well as the number and diversity of market participants all grew dramatically over the past decade. And despite the needed government intervention given the nature of the crisis, trading continued with no mature outages, ETFs proved to be leading indicators of bond price movements, and strong bank balance sheets kept capital flowing.

Global OTC-IRD Interest-Rate Derivatives
Introduction
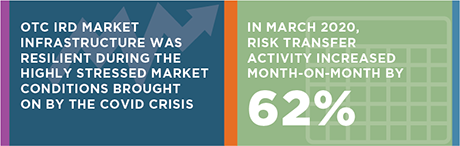
The onset of the COVID-19 pandemic created a sustained period of market stress leading to record volumes across over-the-counter (OTC) interest-rate derivatives (IRD) markets. The market infrastructure nevertheless proved both resilient and highly scalable.
Regulatory-mandated post-trade transparency data, coupled with volume information from central counterparties, allows us to analyze the recent stress period. We look at the elevated volumes traded, analyzing both notional and DV01 amounts to assess risk-transfer activity. We find that both clearing and swap execution facilities were able to scale up to process record volumes.
Throughout this period, liquidity conditions could be monitored via public data, confirming that OTC derivatives markets were continuing to operate. Post-trade transparency, therefore, performed as intended, allowing market participants to follow the large amounts of risk being processed. Volumes in uncleared markets did not react in the same manner as cleared markets. More transparency would enable market participants to better understand why.
Central Clearing—Notional Volumes
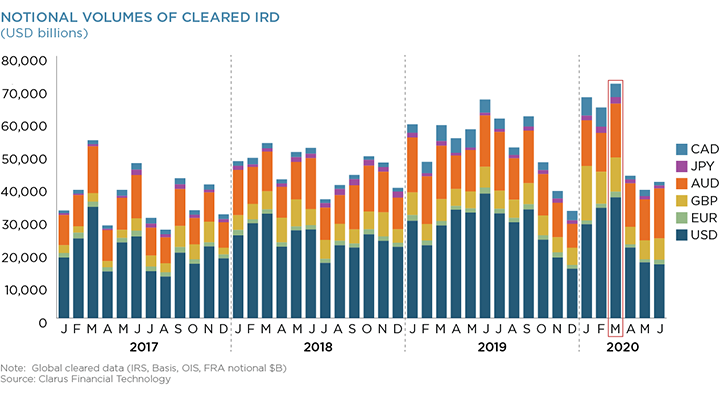
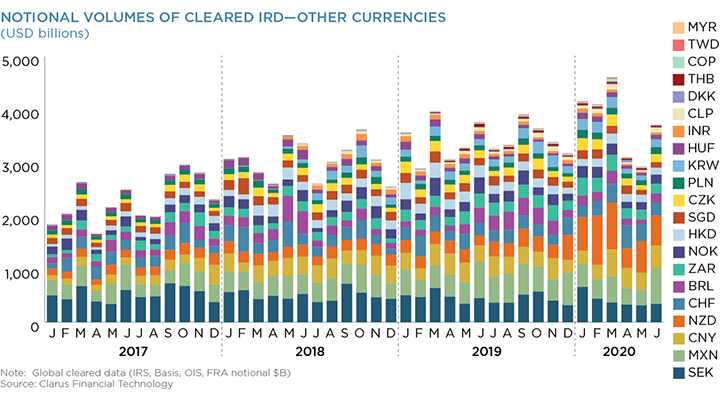
Central counterparties (CCPs) saw record volumes transacted in cleared interest-rate derivatives (IRD)1 during March 2020. Volumes across IRD denominated in the six major currencies surpassed $70 trillion in a single calendar month, with Q1 2020 volumes surpassing $60 trillion in three consecutive months for the first time.
The volumes highlight the global nature of the COVID-19 pandemic. Monthly volumes did not hit a record for IRD denominated in most of the major currencies (CAD IRD did see record volumes). However, when volumes across IRD denominated in all currencies are combined, it resulted in a record month.
Volumes across IRD denominated in all other 21 currencies cleared at CCPs reached a new record of over $4.5 trillion notional cleared in March 2020. This followed two previous record months. These volumes correspond to the portion of the market that actively chose to clear.2 Notably, in volatile markets, with liquidity and access to cash resources at a premium, market participants chose to clear in record volumes.
Central Clearing—Risk Traded
March 2020 witnessed record volumes not just on a notional basis traded and centrally cleared, but on a risk-adjusted basis as well. Notional volumes in OTC derivatives can appear inflated when there is a large volume of short-dated activity, as shorter-dated instruments naturally represent lower risk than longer-dated instruments. This can be the case particularly when central banks are aggressively adjusting monetary policy, such as we saw during March 2020.
We therefore also examine market volumes using a maturity-agnostic measure of risk, DV01.3 This is an industry standard unit of risk, allowing us to translate notional amounts of derivatives into risk amounts. This provides an accurate measure of risk transfer activity in markets.
The following chart translates the USD notional volumes we presented as part of the first graphic into DV01 amounts. It shows that March 2020 saw record DV01 amounts transacted.
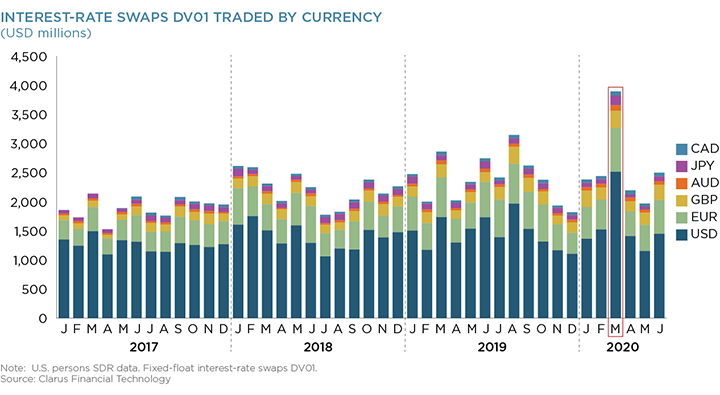
Risk transfer activity increased by 62% month-on-month in March 2020. Activity in April 2020 was just 9% lower than the levels recorded in January and February. June 2020 saw market activity return to previous levels, highlighting how resilient markets were throughout this period of volatility.
Overall, we can state that:
- Large trading volumes in March 2020 were not solely the result of short-dated activity inflating notional amounts. The amount of risk transacted was at record levels.
- The amount of risk transacted in March 2020 was 90% higher than the Q4 2019 average.
- USD IRS saw record amounts of risk transacted, with activity elevated across all maturities, including longer tenors.

Execution Volumes
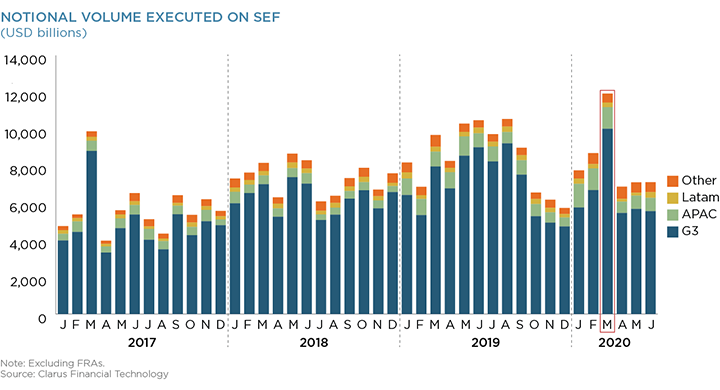
Swap execution facilities (SEFs) in the U.S. saw record notional volumes (>$12 trillion) and amounts of risk (>$3.5 billion DV01) transacted in IRD products during March 2020. There was a 64% increase in risk transacted on SEF between February and March 2020, and the total risk transacted in March 2020 was 18% higher than in March 2019.
SEFs in the U.S. demonstrated that they are stable and transparent execution platforms. They were readily able to scale during the bout of high volatility, thanks to standardized operational infrastructure.
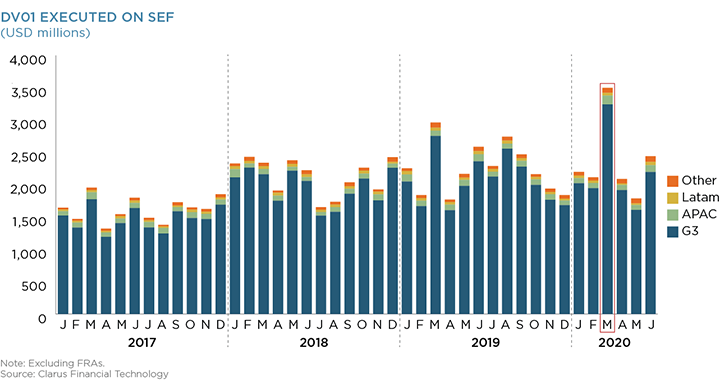
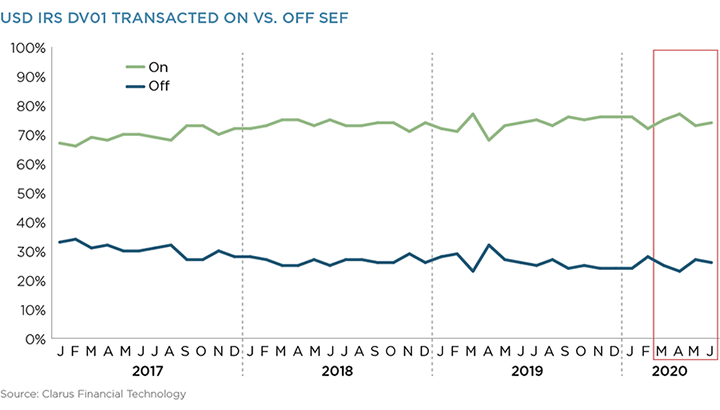
An increasing percentage of USD interest-rate swap (IRS) risk is now transacting on SEF, with 75% of risk executed on SEF during March 2020. This was higher than the previous month (at 72%) and even reached a new all-time high of 77% in April.
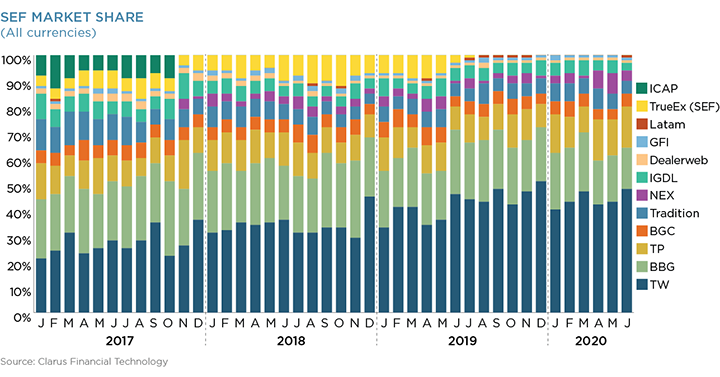
The dominant dealer-to-client (D2C) SEFs (Tradeweb and Bloomberg) again achieved a combined market share of 70% in March 2020 IRS across all currencies.
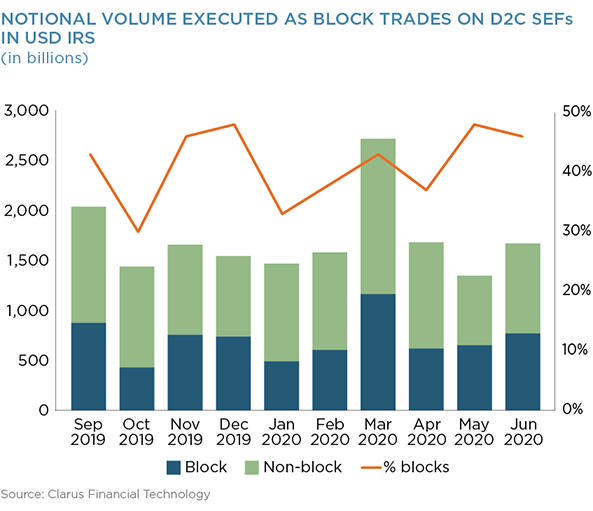
There was a record number of block trades (3,617) executed in USD IRS during March 2020. This contributed to a large percentage of USD IRS notional (43%) being transacted as a block trade across D2C SEFs.
Execution Conditions
Swap data repository (SDR) public data allows market participants to measure the price dispersion4 of standardized instruments. Price dispersion is calculated as the volume-weighted sum of traded prices relative to the VWAP5 for that day. It is representative of bid-offer spreads and the “price” of liquidity.
The price dispersion of 10-year USD IRS did increase during March 2020, as markets were more volatile. Price dispersion returned to more typical values in April.
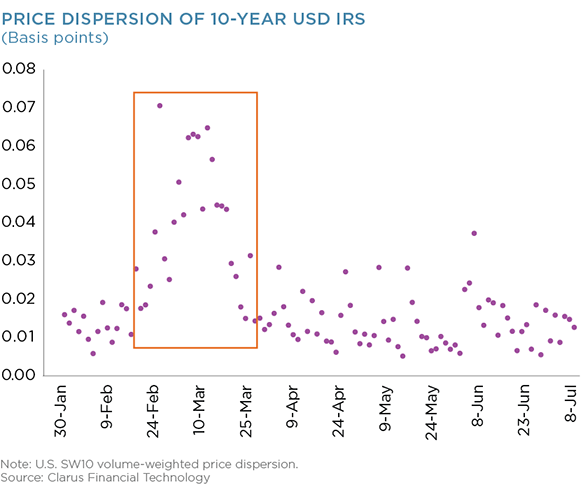
Due to quality and timeliness of the publicly available transaction data under the U.S. post-trade transparency framework, we can also calculate price dispersion for block trades alone. When we do so for March 2020, we find that price dispersion of block trades was almost identical to all other trades transacted during March 2020.
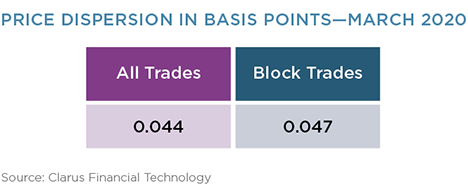
Overall, we can see that execution conditions evolved in a predictable manner in response to volatile markets. Volume data shows that record amounts of risk were transferred, suggesting liquidity was plentiful during March 2020. Price dispersion measures suggest that this liquidity was more expensive to access than during less volatile times. Both volumes and price dispersion have moved lower in tandem since March. In addition, the current block regime worked very well and resulted in the same price dispersion for block trades as non-block trades.
Transparency
Combining both global CCP data and U.S.-specific SDR data allows market participants to measure how much of a given OTC market is subject to post-trade public transaction reporting. Looking at USD IRS (fixed-to-float), we find that the percentage of the market that remained dark was consistent throughout March 2020.
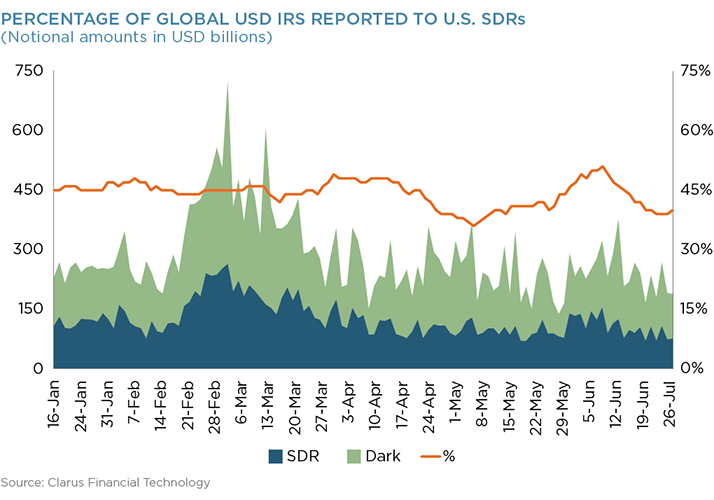
The volume data shows that there was a consistent 45% of global volumes in USD IRS reported to U.S. SDRs. There was no discernible change in this percentage as volumes became particularly elevated (corresponding with the period when price dispersion measures were also highest). There was therefore no evidence that markets moved to avoid transparency requirements where they are in place.
Margin
Initial Margin (IM)
The amount of IM held at the CCPs6 increased in Q1 2020. There was a 23% increase between the end of 2019 and the end of March 2020, equivalent to a change in IM requirements across the industry of $50.5 billion.
House IM7 increased by 18% ($15 billion) compared to an increase of 26% for clients ($35 billion).

Variation Margin (VM)
The major IRD CCPs saw record maximum VM amounts called during Q1 2020, resulting in an increase of $15.7 billion quarter-on-quarter (a 53% increase). VM represents the daily fluctuations in the mark-to-market of a portfolio. VM calls are therefore naturally higher during volatile markets when price moves are larger than normal.
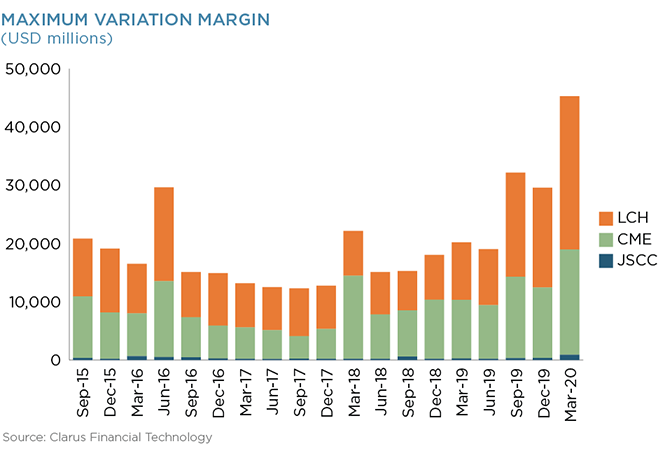
Previous peak VM amounts have been caused by the unexpected Brexit referendum result in June 2016, for example. The onset of the COVID-19 pandemic caused an even larger effect. Peak VM went up by $15.7 billion quarter-on-quarter (a 53% increase). VM calls must be met in cash from CCPs, and this demonstrates the (peak) funding requirement that may have occurred during the crisis.
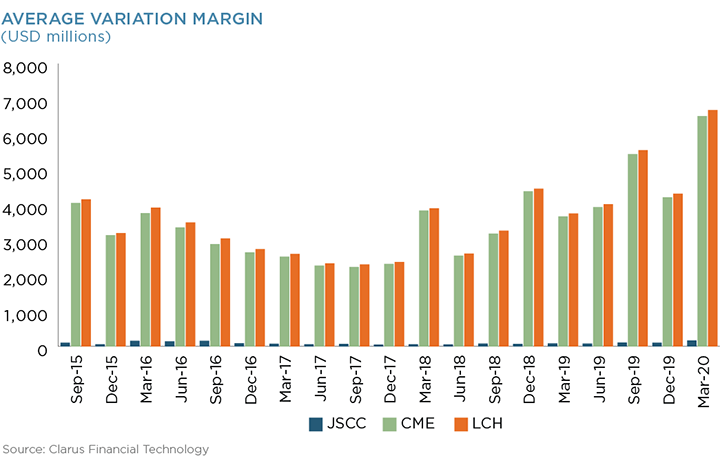
Average VM calls during a quarter highlight the increase in volatility caused by the COVID-19 pandemic. Amounts increased by 55%, equivalent to $2.4 billion per day across these three CCPs, 20% higher than the previous peak (September 2019).
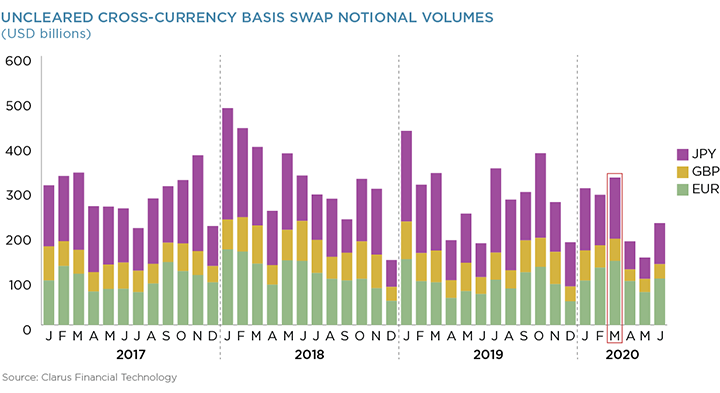
Uncleared Markets
Notional volumes reported to U.S. SDRs for cross-currency swaps show no increase in activity during 2020. This is surprising, given that increasing USD availability was a key part of the coordinated central bank response to the pandemic, achieved via central bank FX swap lines among 15 jurisdictions. These facilities allowed domestic counterparties to swap local currency for USD directly with their local central bank for up to three months. There was an enthusiastic uptake of these FX swaps,8 which was expected to filter down into bilateral markets.
There was also no increase in swaptions trading activity reported to U.S. SDRs. In fact, the data suggests that activity in swaptions has been extremely depressed since the end of February 2020, despite aggressive recalibration of monetary policy from several central banks.
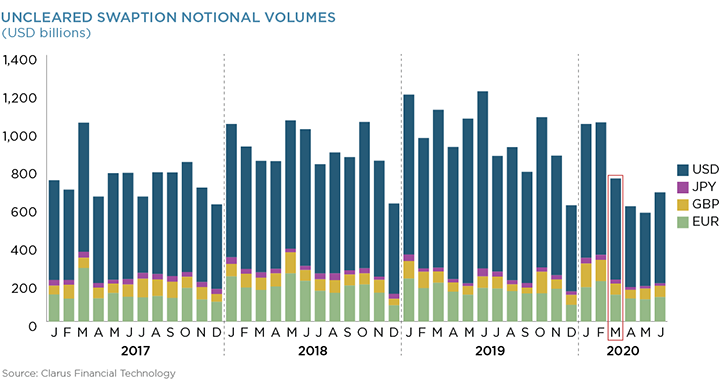
Data shows that activity increased significantly in cleared markets, reaching new records. This behavior was not seen in uncleared markets, where market activity was relatively subdued.
Conclusion
OTC IRD market infrastructure was resilient during highly stressed market conditions. CCPs successfully cleared record volumes in IRDs. SEFs saw record volumes, with clients executing more block trades than ever before.

Post-trade transparency worked, providing reassurance to market participants that OTC derivative markets continued to operate, quantifying the amount and price of liquidity available. Post-trade transparency operated as intended, with no evidence that market participants moved execution to less-transparent jurisdictions.
Market participants would benefit from more transparency surrounding both margin calls (in cleared and bilateral markets) and uncleared markets (across all jurisdictions). Volumes in major uncleared markets did not react in the same manner as cleared markets. More transparency would enable market participants to better understand why.

1The IRD products covered are interest-rate swaps (IRS), overnight index swaps (OIS), single-currency-basis swaps (SCBS), and forward rate agreements (FRAs). Volume data is collected from CCPs directly, with all notional amounts recorded on a “single-count” basis—i.e., prior to novation to the CCP—and accessed via ccpview.clarusft.com.
2IRD denominated in most of these 21 additional currencies do not have clearing mandates in place, while IRD denominated in the six major currencies are mandated to clear in major jurisdictions, such as the U.S. and Europe.
3The DV01 of an interest-rate derivative is the “discounted value of a basis point”—AKA an “oh one,” equivalent to 0.01%. This describes the valuation change in a derivative contract resulting from a (parallel) one basis point (0.01%) shift in the interest-rate swaps that are used to value it.
4See https://www.clarusft.com/usd-swap-markets-during-covid-19-pandemic/ for methodology.
5Volume Weighted Average Price
6The four largest CCPs for OTC IRDs are included in the data – CME OTC, LCH SwapClear, Eurex OTC and JSCC.
7House accounts at CCPs are typically considered a proxy for the dealer community.
8See https://www.clarusft.com/central-bank-responses-to-covid-19-fx-swap-arrangements/
Foreign Exchange

Introduction
The impacts of the COVID-19 crisis on foreign exchange (FX) markets were both profound and also somewhat difficult to observe. That said, what we can observe in the more transparent segments of the FX market is illustrative of conditions on a larger scale. Most transparent is the activity that occurs on electronic communication networks (ECNs). On these trading venues, March 2020 witnessed substantial increases in volumes coupled with a meaningful widening of spreads.
Spreads have contracted relatively quickly from their peaks but have been slow to fully normalize. The key takeaways are that markets continued to function and that by charging wider spreads, liquidity providers were compensated for the increased risk they faced during volatile markets—exactly what one would expect of functioning markets.
FX Market Structure
To understand these dynamics more clearly and why a fuller analysis of FX markets is difficult, it is important to first start with an explanation of FX market structure.
Foreign exchange markets are composed of four products: spot, deliverable forwards and swaps, non-deliverable forwards, and options. FX futures also exist but are, in essence, a listed forward. Spot FX is the “cash market”—the straight exchange of one currency for another.
An FX swap contains an element of time and, therefore, also includes a counterparty credit element. It is an agreement to exchange currencies at some point in the future. A non-deliverable forward (NDF) is similar to a swap but is executed in a currency whose central bank has imposed restrictions on the convertibility of that currency into others—so an NDF is settled in the original currency. Options are puts and calls on foreign exchange rates, similar to equity or index options.
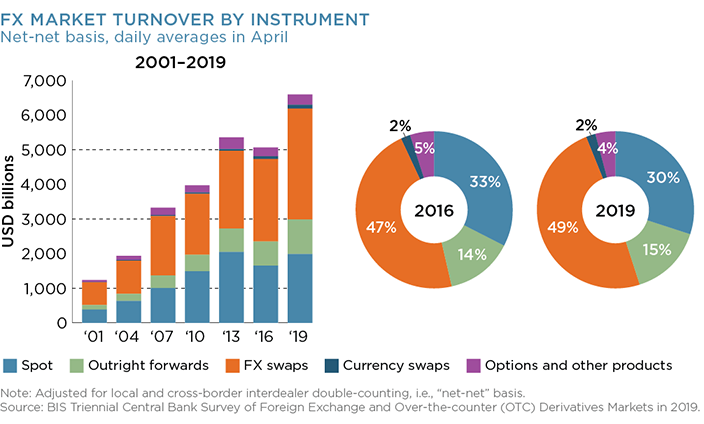
Interestingly, the most popular FX instrument according to the Bank for International Settlements (BIS) is the swap. This is because firms often fund themselves in currencies other than their own, or have obligations or receipts due in another currency at another point in time. This makes the cross-currency swap market extremely important. In fact, this market was the scene of important activity by the official sector in the course of the COVID-19 crisis, as intervention in cross-currency swap markets is a way for central banks to extend liquidity outside their borders.
In addition to the differentiation of FX markets by product, it is also important to note that FX markets have a unique structure. While banks and a number of nonbank liquidity providers are at the center of the market structure, there are numerous execution methodologies open to market participants. There is voice trading in FX, which we will mention later, but the vast majority of FX volume trades electronically and has for some time.
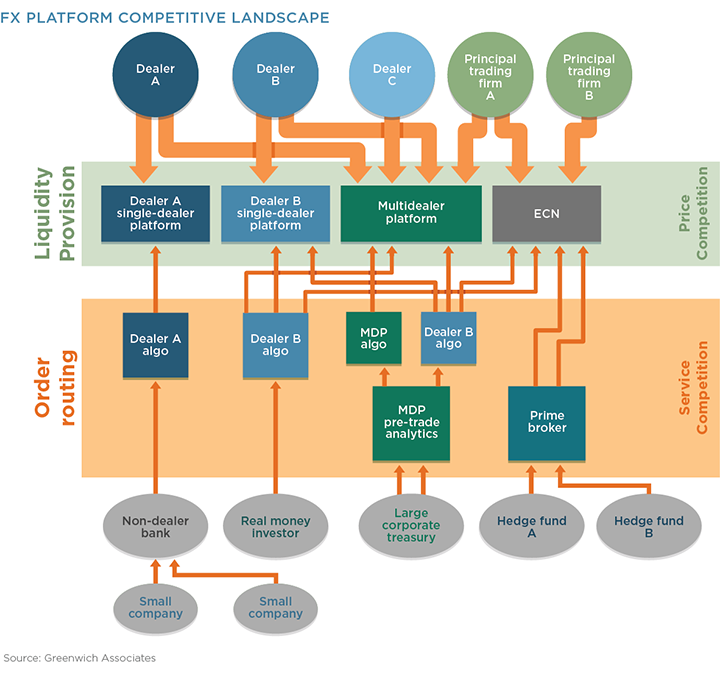
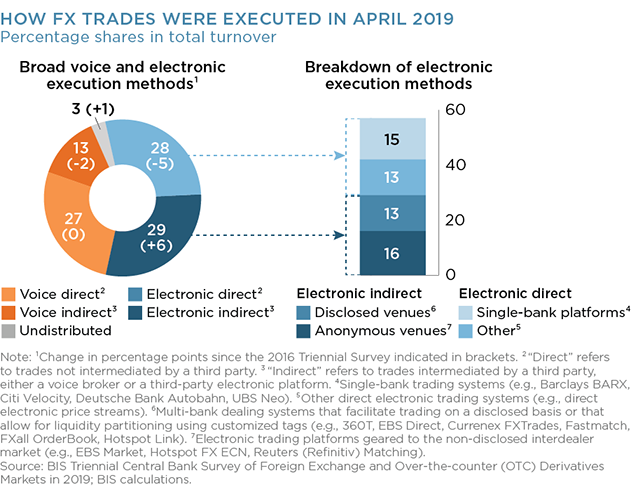
The execution methods fall into a number of categories, with many venues within each. At Greenwich Associates, we break these categories down into SDPs, MDPs and ECNs:
- Single-dealer platforms (SDPs) are operated by a single liquidity provider that provides streaming or RFQ markets directly to its clients.
- Multidealer platforms (MDPs) offer individual clients simultaneous access to streams or RFQs from several dealers and often offer additional services. Clients must have clearing relationships with their counterparties on MDPs because the MDP is not itself a counterparty to the trade, and the dealer and customer are known to each other.
- Electronic communications networks (ECNs) are similar to MDPs except that they offer anonymous rather than disclosed trading. This gives them more freedom with regard to trading protocols but requires customers to have credit intermediaries, typically a prime broker, in order to preserve their anonymity.
The FX markets are, thus, competitive at several levels. Liquidity providers compete with each other through their venues and by price on venues that offer access to multiple dealers. The platforms compete with one another by offering a variety of other services, such as hosted algos or different workflow and analytical tools.
There are a number of other important features of the FX market. First, it is overwhelmingly bilaterally cleared. While CLS clears some currency pairs among its members and LCH and CME offer clearing of certain derivatives, the dominant clearing arrangement is bilateral. What’s more, deliverable FX swaps and forwards are exempt from the initial margin requirements of Uncleared Margin Rules (UMR), which means that the next wave of derivatives legislation will pass them by.
Another important element of the FX markets, and one that hampers analysis of the impacts of the COVID crisis, is the absence of any reporting requirements. There is no equivalent of the consolidated tape in equities or TRACE in fixed income. The industry standard estimate for FX volumes is not conducted live and only every three years by the BIS. This means that the live monitoring of a major event like the COVID crisis is an impossibility.

The most recent survey released in December 2019 showed the breakdown by various execution methods and, therefore, gives an insight into how much of the market is observable on a daily basis. To be clear, voice trades, which represent almost half the market, are not included. Further, among FX trading venues, no SDPs report and only some of the MDPs do (and not in a uniform way). The most transparent are the anonymous ECNs, but these represent only 16% of the total FX market volumes.
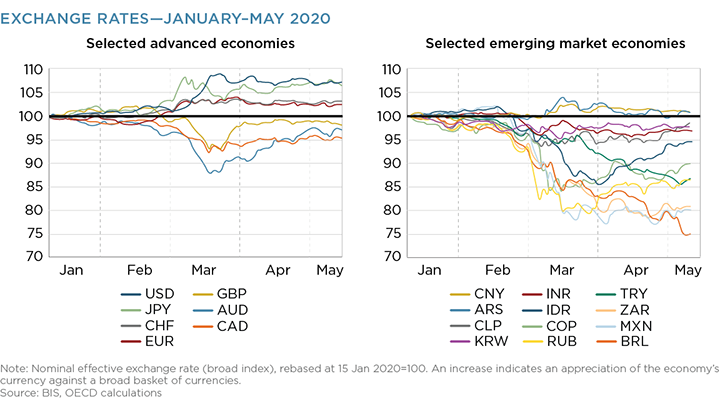
Flight to Safety
With the overall FX market structure as a background, it is helpful to describe what actually happened in the initial phases of the COVID-19 pandemic. From an FX perspective, two main effects occurred largely simultaneously. The first was a flight to safety within the G10 currencies and a flight away from emerging markets. The second was a significant tightening in short-term lending markets, as corporations around the world drew down their revolving credit lines and sought to shore up their cash positions.
Corporates took these actions in order to ride out the mandatory lockdowns that governments around the world imposed to slow the spread of the virus. This effect was most easily visible in repo markets. Of course, because FX swaps also have a credit component and many companies fund in G10 currencies, even if their operations are based outside the G10, these actions significantly stressed cross-currency basis swaps.
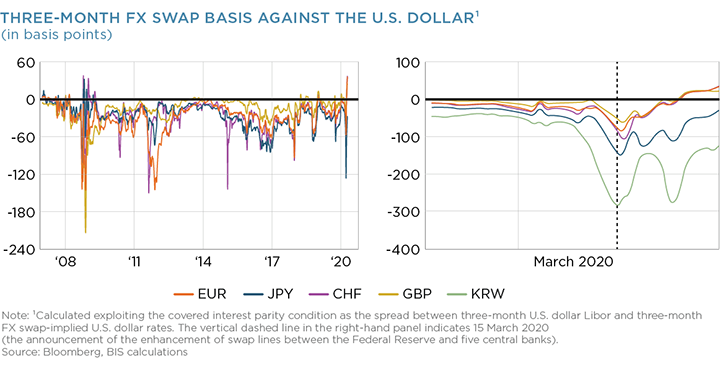
The difficulties experienced by users of short-term funding markets as well as the cross-currency basis prompted the initial waves of official sector intervention. The Federal Reserve has permanent swap lines with the Bank of Canada, the Bank of England, the Bank of Japan, the European Central Bank and the Swiss National Bank. On March 19, the Fed opened swap lines to the central banks of Australia, Brazil, South Korea, Mexico, Singapore, Sweden, Denmark, Norway, and New Zealand for a combined total of $450 billion.
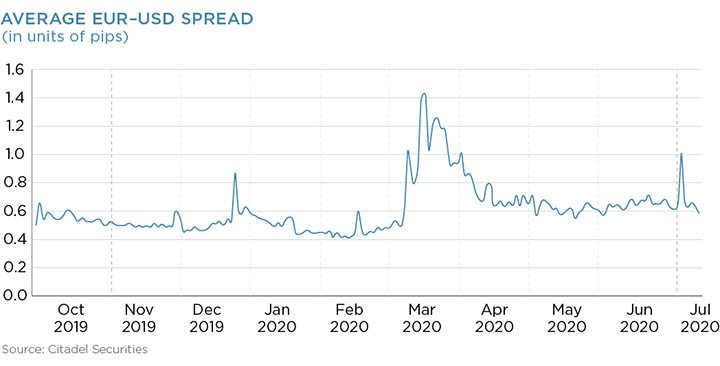
Perhaps the best place to observe the effect of the COVID-19 pandemic on liquidity in FX markets, and perhaps as a proxy for the liquidity in all instruments, is in the bid-ask spread observed in the USD/EUR spot rate. According to the BIS, USD/EUR trades on the order of $500 billion per day, making it the most liquid single instrument in the world. Even on-the-run cash U.S. Treasuries, which trade in similar volumes, are divided among 30 CUSIPs. The average USD/EUR bid-ask spread nearly tripled from around half a pip to 1.4 pips, a significant widening that, despite official sector intervention, has yet to fully return to normal.
As the most liquid and the most observable currency pair, it can be assumed that this effect was felt across the whole FX asset class, with other OECD currency pairs experiencing similar effects and emerging markets pairs expanding even more widely. It is likely that when market participants express concerns about liquidity, they are referring to increases in spreads, rather than an inability to execute.
Trading Volumes
To the extent that FX market volumes are observable, they increased very substantially during the course of the crisis. This was true across all platforms and protocols. The ECNs are the most transparent about their trading volumes, which were up significantly. For example, Cboe FX reported March ADV of $55 billion vs. $41 billion in February and $38 billion a year earlier. Euronext FX reported an average of $129 billion per day in March, up from $106 billion in February and $101 billion a year earlier.
EBS, the ECN owned by CME Group, had an ADV of $131 billion in spot FX for March, up 45% from February and up 58% from a year earlier. MDPs experienced increases as well. For example, 360T, an MDP favored by corporates and increasingly by hedge funds, had an ADV in March of $37 billion, up 36% from February and up 71% from a year earlier. Refinitiv, which operates both Matching, an ECN, and FXall, a large MDP, had an ADV of $540 billion across all products, a significant increase over the $450 billion in February and $428 billion in March 2019.
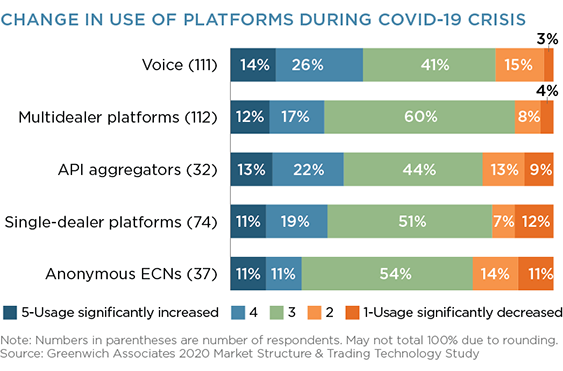
As impressive as the increases in the volumes on the platforms are, they likely give an underestimate of the actual increases in volumes. As reflected by FX users in the study, the execution methodologies that experienced the greatest increase in usage were API aggregators, SDPs and voice trading against the dealers, none of which report their volumes to the public.
Additionally, when asked what the most significant change in their trading behavior during the crisis was, by far the most common response was that the importance of relationships increased. Of the respondents, 67% said an increased reliance on their relationships was the main change in their trading behavior, more than twice as much as the next most common response.
Conclusion
FX markets continued to function even in the depth of the crisis, with market makers staying active—albeit via quoting wider spreads—and electronic marketplaces continuing to operate well despite spikes in volume.
FX markets are unique, given they are more often a means to an end than an investment focus in their own right. However, that does not imply they are any less critical to overall market functioning—the reality is often the opposite, in fact. Therefore, increased transparency into this very global and very diverse market is paramount in the years ahead.
This Greenwich Associates research is primarily based on data from the first half of 2020 that was analyzed in July and August and conversations with liquidity providers, investors, regulators, exchanges and trading platform operators. The analysis also utilized numerous sources of both public and private data including but not limited to FINRA, the Federal Reserve Bank of New York, OPRA, MarketAxess, Bloomberg, Clarus Financial Technology, DTCC, and BIS.