

It’s official: The Canadian Big Six are now the Big Seven. Desjardins Capital Markets has joined RBC Capital Markets, TD Securities, BMO Capital Markets, Scotiabank, CIBC, and National Bank Financial to gain entry into the country’s...
We strongly believe the human banker will remain the cornerstone of commercial and corporate banking relationships. Going forward, AI will make bankers more effective in their client interactions by customizing presentations, generating personalized insights and recommendations, and contributing to solutions tailored to individual clients.

It’s official: The Canadian Big Six are now the Big Seven. Desjardins Capital Markets has joined RBC Capital Markets, TD Securities, BMO Capital Markets, Scotiabank, CIBC, and National Bank Financial to gain entry into the country’s...
Compensation for retail structured products professionals remained flat.
Compensation for financial professionals trading Fixed Income products in the U.S. increased slightly in the past 12 months.
Compensation for financial professionals trading Latin American Fixed Income products increased slightly in the past 12 months.
Compensation for financial professionals trading Fixed Income products in Canada increased slightly in the past 12 months.
Total compensation for Equity Derivatives traders increased last year.
Total compensation for Equity Derivatives traders increased last year.
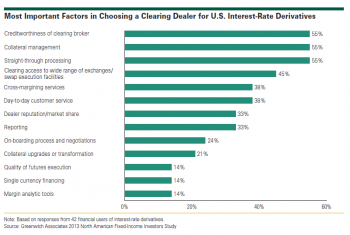
U.S. institutional investors concentrate even more of their rates-trading business with big banks.
This report provides detailed information on the top performing Equity traders and analysts in Europe.
This report provides detailed information on the top performing Fixed Income traders and analysts in Canada.
Access timely info via personalized dashboard
Receive webinar invitations and set up your preference
Save Coalition Greenwich Research in a personal folder